Architect: Duda Paine Architects
MEP Engineers: IMEG Corp
Contractor: Holder Construction
Consultants: Pattern
Correlated Analysis to Design Phase
Climate Analysis
Pre-Design and Concept Design
Energy Analysis
Concept Design and Schematic Design
Daylight and Glare Analysis
Schematic Design & Design Development
Facade Studies
Design Development & Construction Drawings
Water Use Analysis
Concept Design and Schematic Design
Cost v. Energy Optimization
Design Development & Construction Drawings
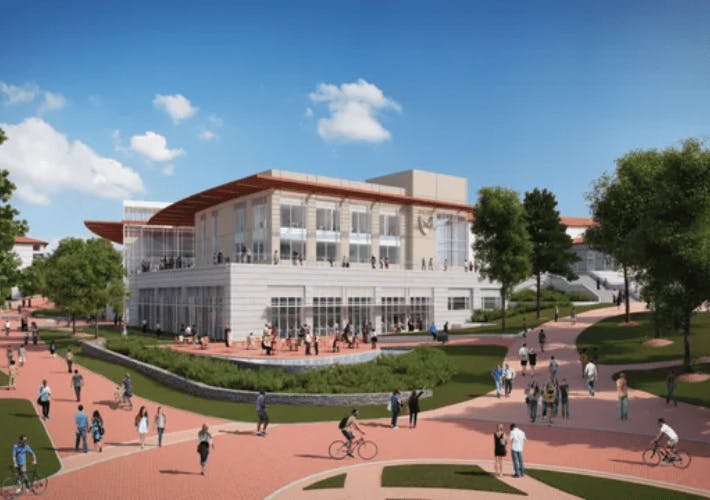
Project Overview
At 117,00 sq. ft., the Campus Life Center on the Emory University campus caters to the growing space demands, allows flexibility and efficient dining services, technology and infrastructure upgrades, and more room for student organizations and gathering space. With the University’s commitment to sustainability, the Campus Life Center has high performance targets.
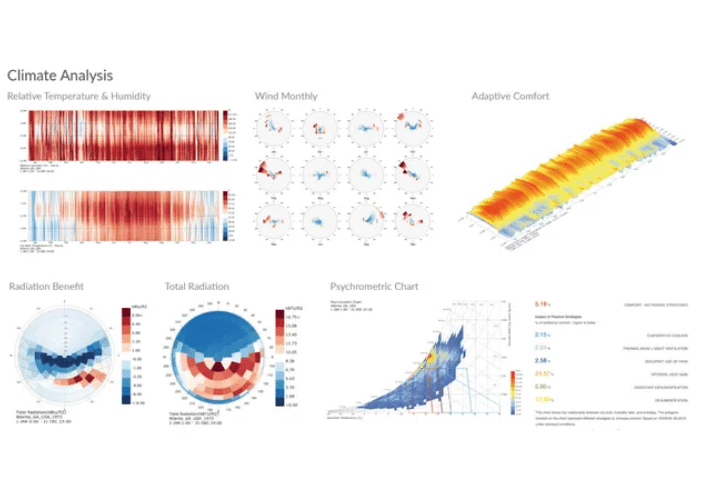
Climate Analysis
Climate Data – A basic understanding of the existing climate conditions is vital for making performance design decisions. The following climate studies are created `automatically using cove.tool.
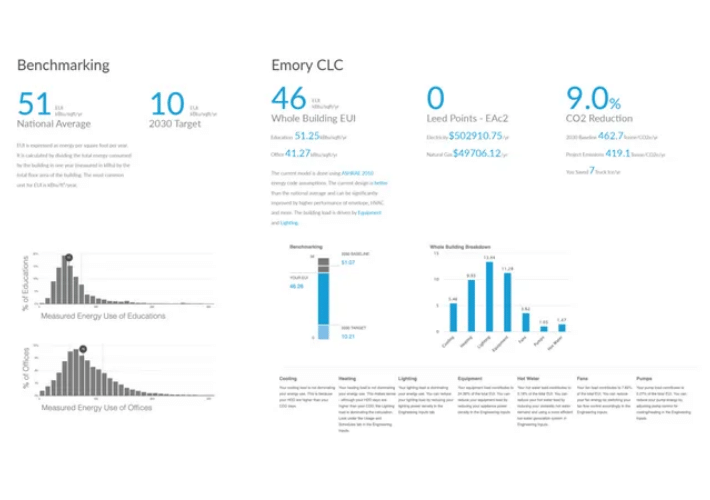
Energy Analysis
A basic understanding of target values is key to comparing performance design decisions.
EUI – Expressed as energy per square foot per year, knowing the EUI values of design decisions and other iterations, one can get the best value for performance. Below the design team used cove.tool to find their buildings benchmarks in order to inform and guide the team towards setting their own energy targets. The USA national median for EUI was 51 kBtu/sqft/yr .
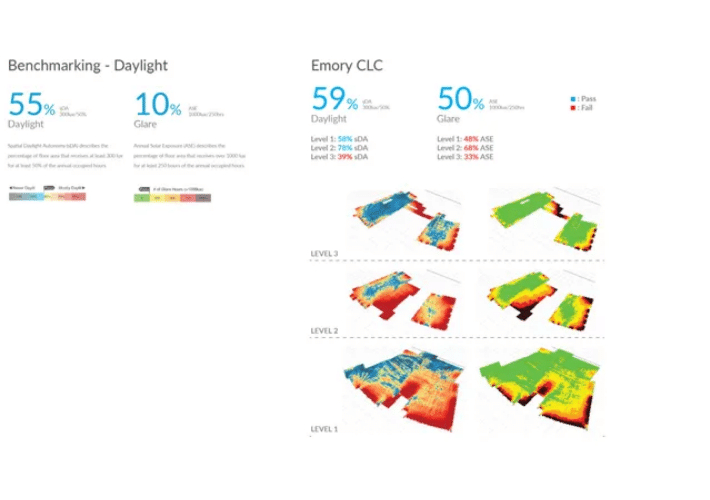
Daylight and Glare Analysis
Daylight quantity and quality is a critical part of any building. It becomes especially critical when studying a campus center with students. Many studies have linked daylight to productivity and wellness. cove.tool allowed the team to use the Revit model export for the following daylight and glare studies.
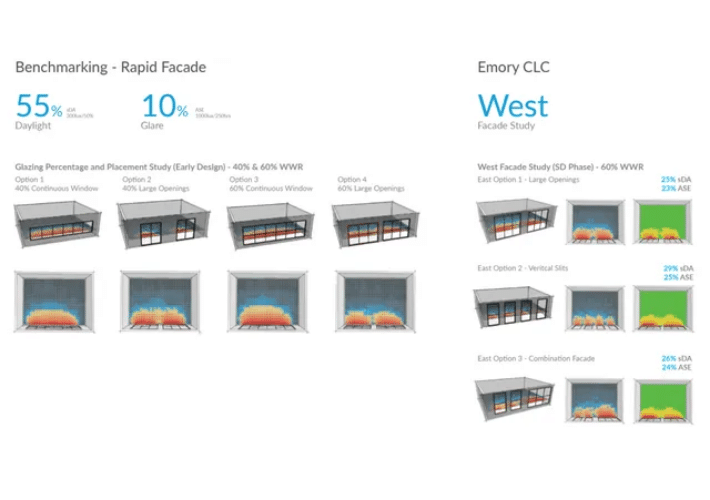
Facade Studies
The ability to rapidly test out varying facade design and compare glazing percentage, overhangs vs fins, window sizes and location was critical for the facade design. The below study created using cove.tool’s rapid facade prototyping features allows users to do that in minutes.
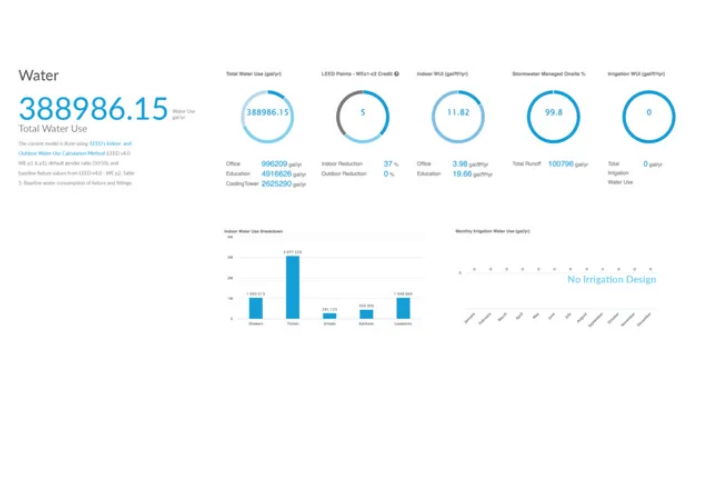
Water Use Analysis
Being a part of the campus meant studying not just indoor water use for low flow fixtures, but also outdoor water use. This meant grey water re-use strategies, storm water capture, rain water harvesting, irrigation and more. The cove.tool water feature had not been launched at the time of this project. This feature allows users to study indoor and outdoor water use for their project as shown below.
Cost v. Energy Optimization
Being a integrated team with the contractors on board at early stages of design, cost was a critical component of decision making throughout the design. This cost was able to be optimized using cove.tool. cove.tool uses advanced algorithms to optimize for first cost and assists in making rigorous metric based decisions on cost and energy.
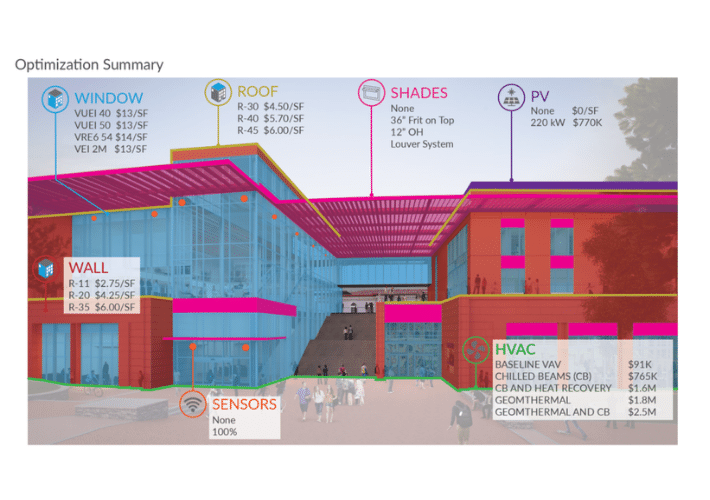
As seen in the diagram above, many decisions including, window type, wall insulation, roof insulation, HVAC, Photovoltaic panels, shading strategy and sensors had multiple options that needed to be tested. This leads to over 20,000 possible combinations, each with a different energy use and a different cost. cove.tool allowed studying these to discover the most cost optimal way to get to the best performance.
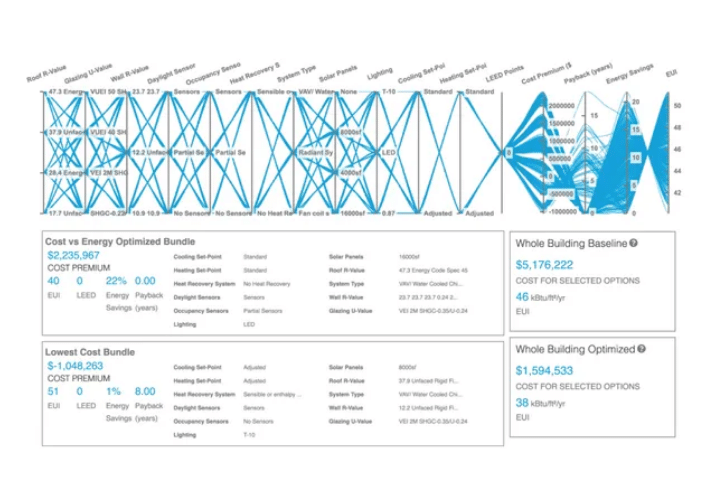
In the graph above, each vertical line represents one decision. The blue line represents every possible combination and these can be filtered based on potential LEED points, EUI, Energy Savings, Payback and First Cost Premiums. For a project with a target payback less than 10 years and EUI target of 45 or below.
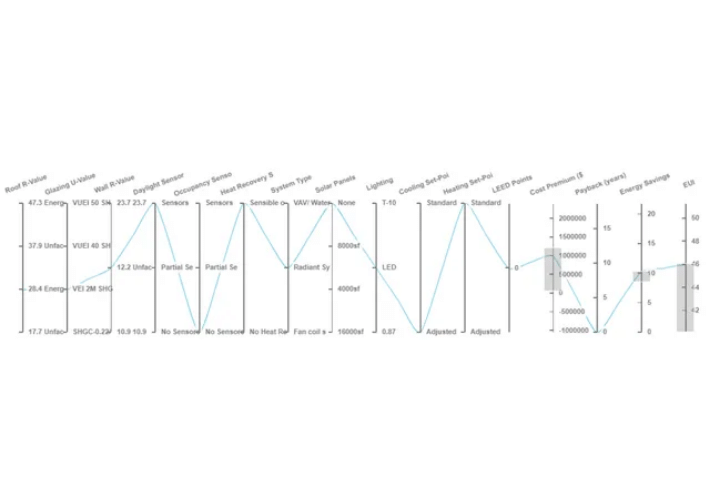
The design team used cove.tool to find the absolute lowest cost option.