2013, Phase 1 of Health Sciences Research Building Image Courtesy EYP
Project Profile
Health Sciences Research Building – At 300,000 sq. ft., the Health Sciences Research Building II is the second phase of a new biomedical research facility designed to foster a collaborative research community. HSRB II will cater to the growing space demands, efficient and flexible research labs, technology and infrastructure upgrades, and more. The new facility is an expansion of a large complex with 60 percent of the program dedicated to pediatric research and the remainder focused on other cancer, immunology, and drug discovery research.
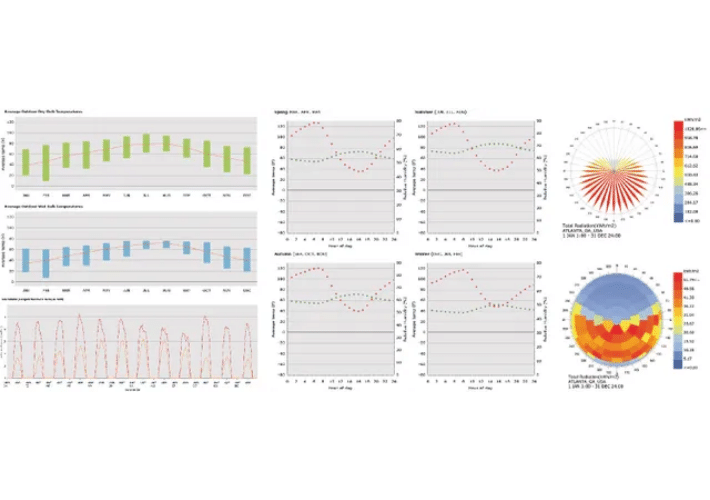
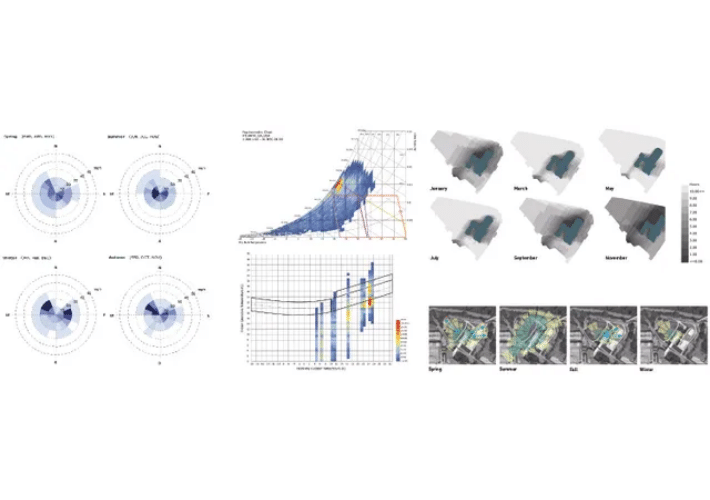
Understanding the Climate
Climate Data – A basic understanding of the existing climate conditions is vital for making performance design decisions. Optimizing the massing design during early-stage modeling makes sure the building is energy efficient without additional cost impacts. Using a range of climate analysis diagrams to shortlist strategies in terms of building shape, orientation, or glazing percentage collectively correlates to the building’s final energy and cost performance.

Massing Study
The first step of any design team is to short list massing strategies. The best way to narrow the field is running early stage energy models to determine which overall massing best meets the design teams performance target.
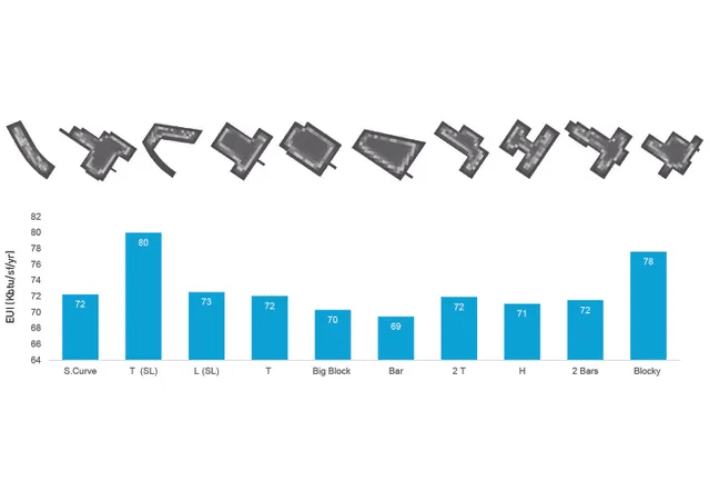
Performance Based Decision Making – The design team proposed 10 possible massing, each varying in shape, height and orientation. The set of diagrams below shows two type of performance based decision making approaches when studying massing. The first is a side-by-side comparison using EUI’s and Daylight (sDA) to determine each the best performing options. The second is a parametric process which evaluates the options on a parameter based field. Rather than compare and contrast the two, the sustainability consultants combined the methods to quickly move from 10 options to two.
Method 1: Side-by-side Comparison of EUI
Energy (EUI, kBtu/ft2/yr)
Method 2 : The Parametric Process
In this portion the parametric process will demonstrate the advantage a parameter driven decision making. Cove.tool uses this method to mapped input data as interlinked parameters, so whenever you are ready to compare a set of options every high and low which makes up the combination is visible.
Below, a Parallel Coordinate Graph his has the 10 massing options mapped on to it
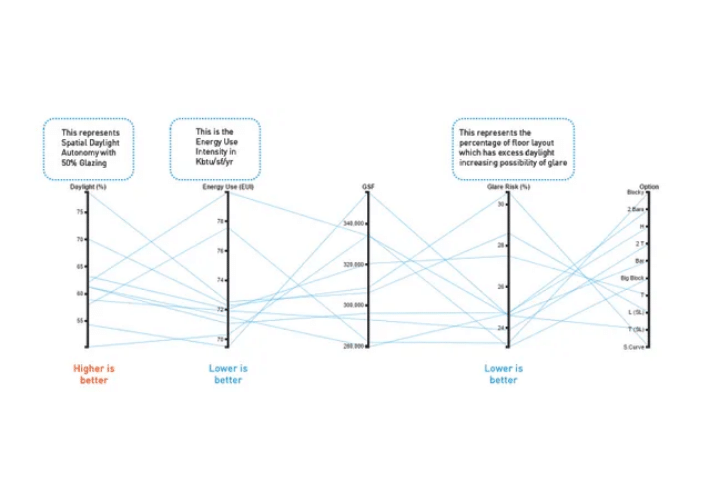
With the use of a parallel coordinate graph, users are able to weed out certain bundles which do not hit the users bottom-line goals. Here, two from the ten remain after the design team calibrated the graph to ensure the massing options would have a low EUI, an in between Gross Square Foot Area, and low glare risk.
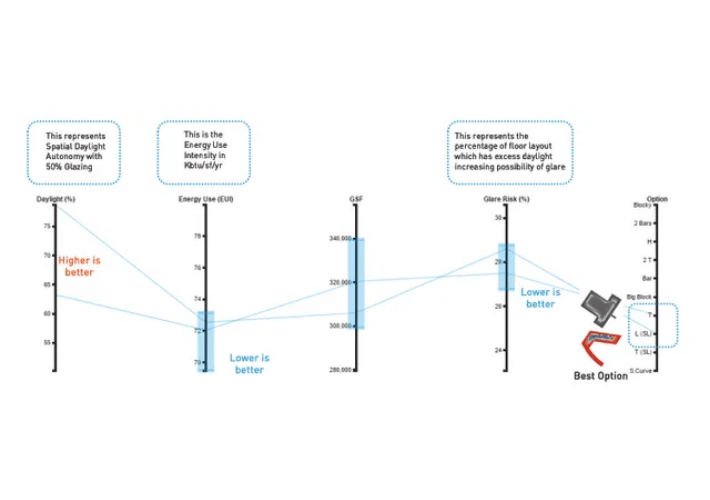
Schemes which performed the best include Massing – L-Scheme and T-Scheme.
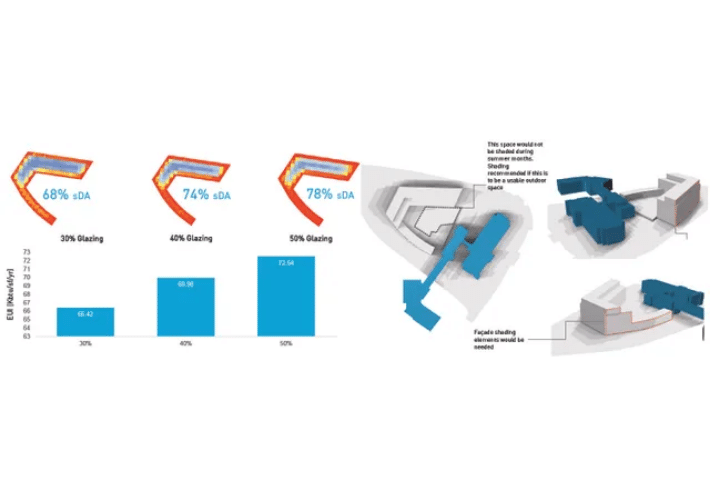
Massing L-Scheme
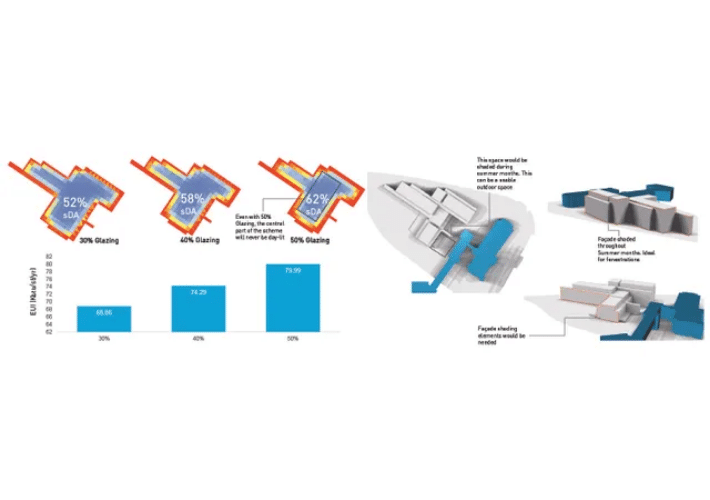
Massing T-Scheme
Final schemes show similar high performing options which ensure that the final decision will at least be a quick and thoroughly selection process.
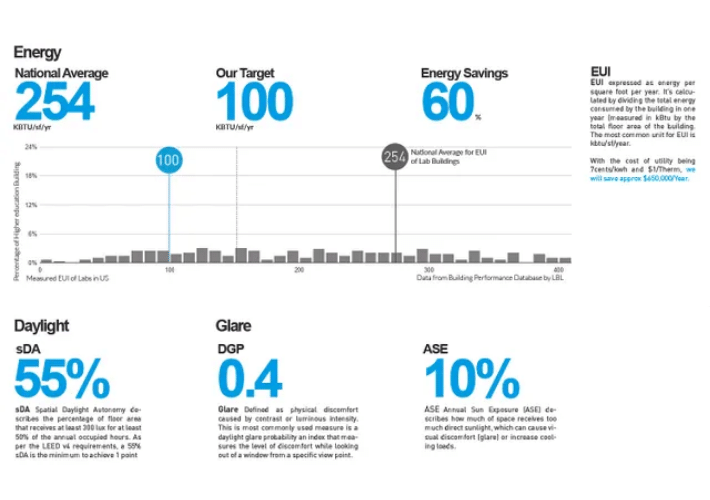
Setting up Benchmarks
Benchmark Data – A basic understanding of target values is key to understanding a buildings performance status.
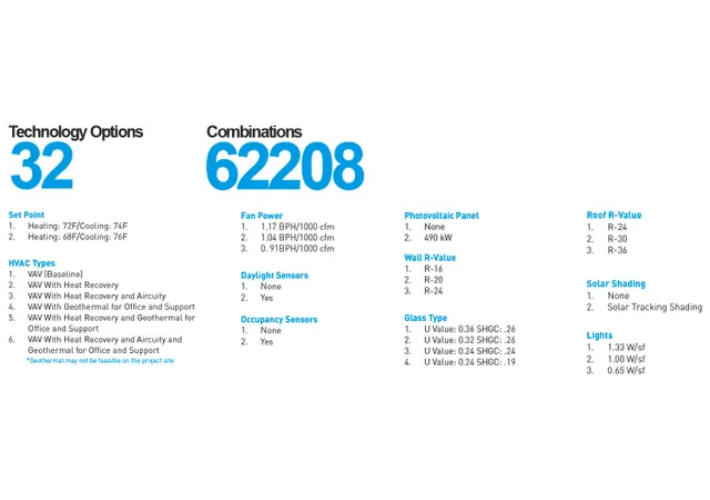
Sustainability Review
Reviewing the bundles – Cove.tool uses advanced algorithms to optimize for first cost and assists in making rigorous metric based decisions on cost and energy. The different technologies and their options are listed to the left.
Here (below), cove.tool recommends a top bundle before any additional options are changed.
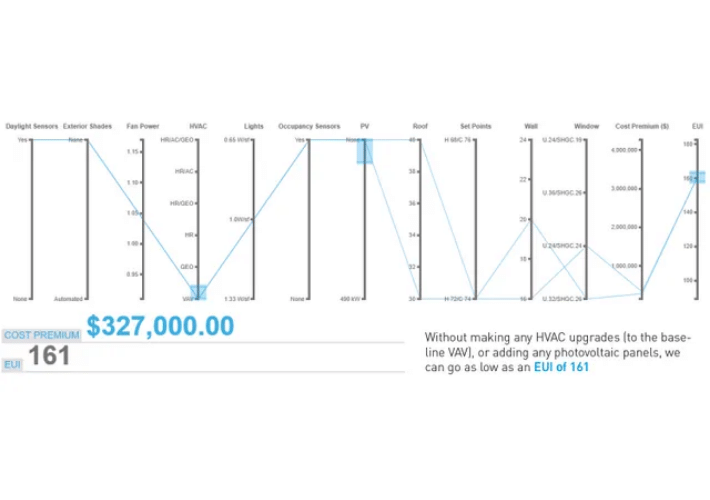
One parameter, HVAC system, is selected and new optimal bundle arises.
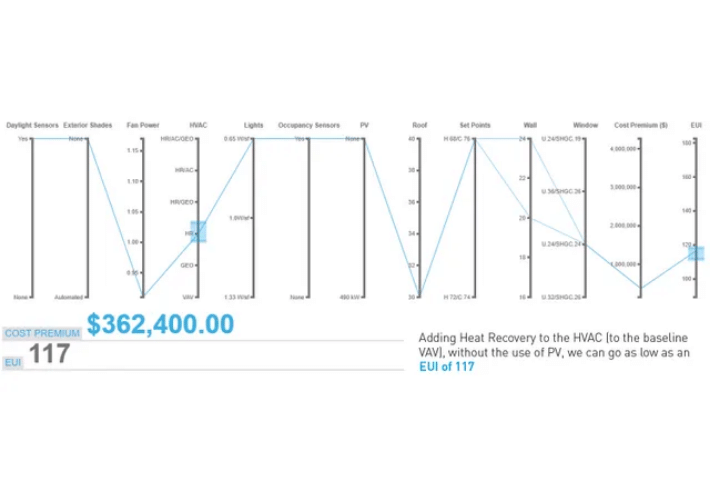
Continued calibration of parameters and design team requests show how low the possible bundles could go.
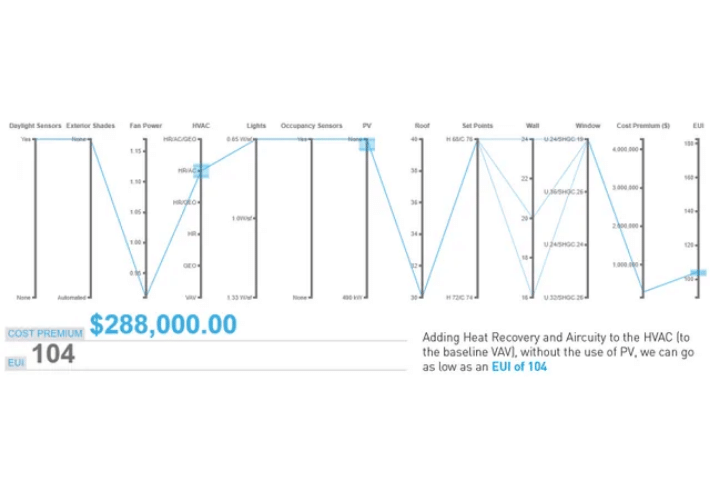
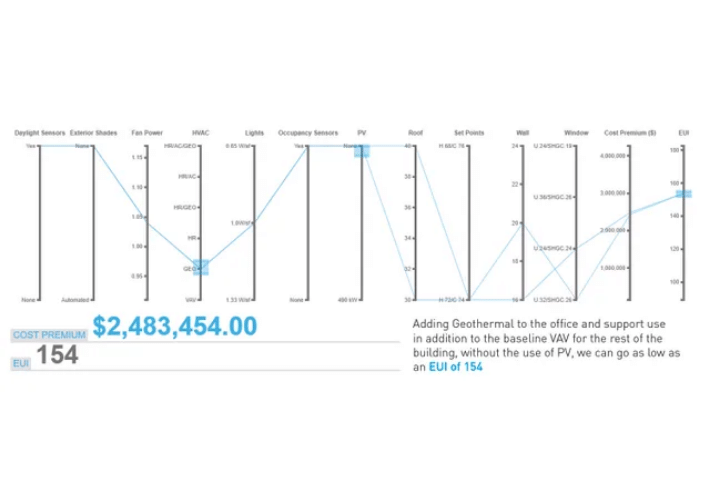
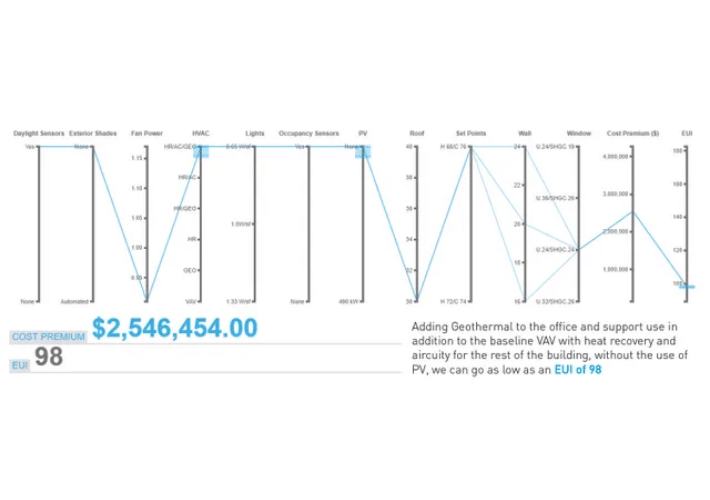
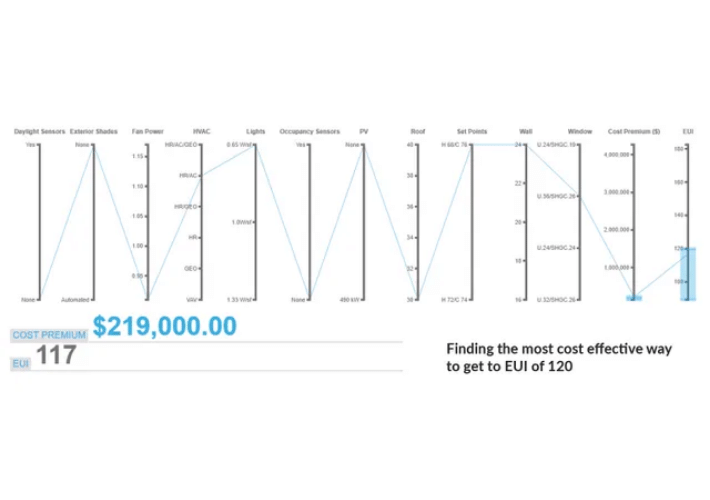
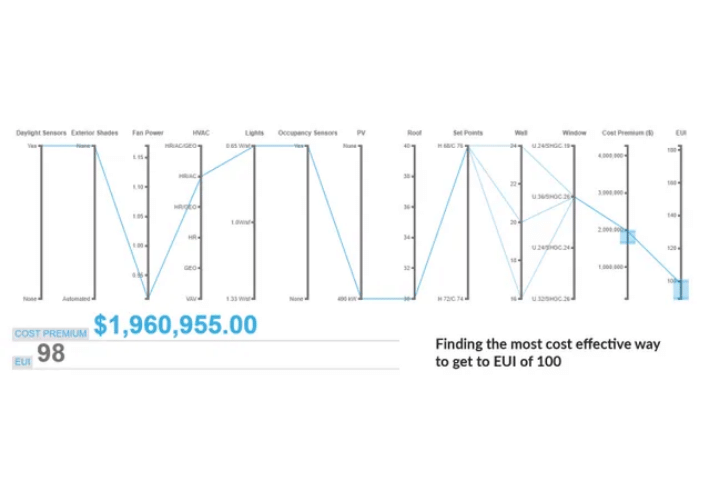
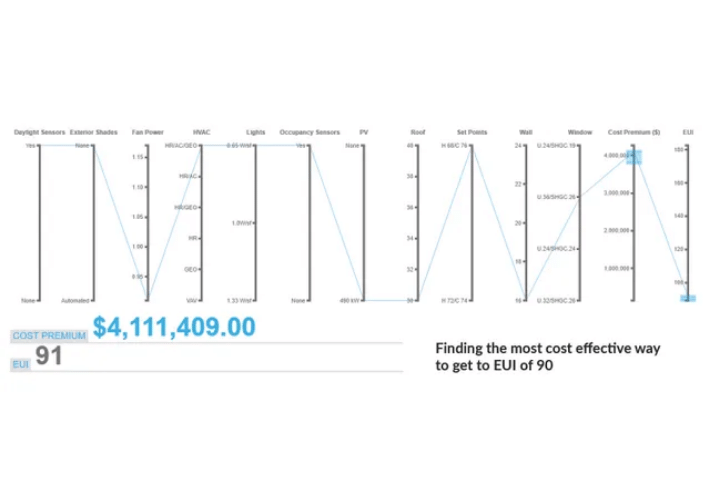
Comparing Best Bundles at each EUI segment
Upon the design team’s request to compare impact of cost and system/strategy combinations has at each peak EUI ‘10x’ segments, cove.tool ran the following graphs to show how each EUI target segment could be used to short-list paths forward.
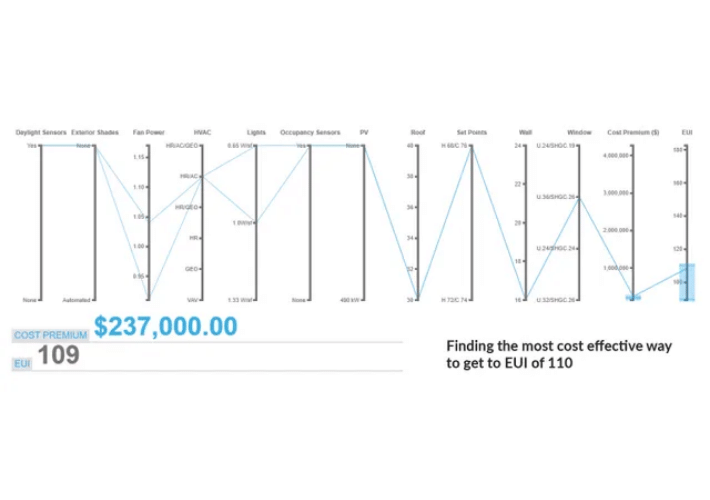
Suggested Bundle
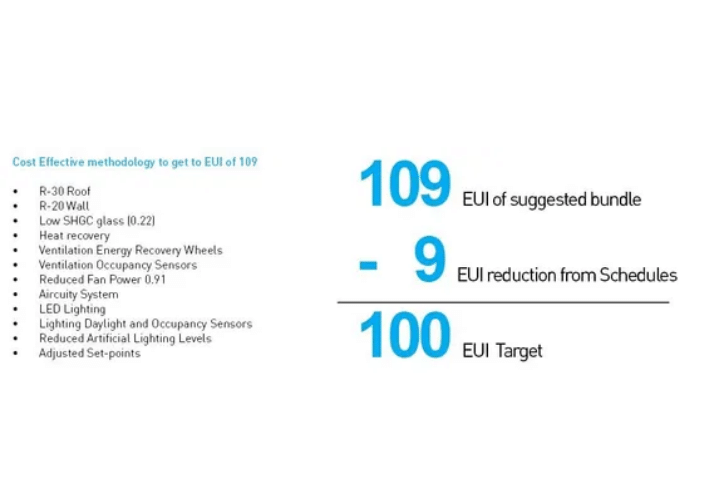
The cove.tool energy model undertaken showcases schedules that are fairly conservative and does not reflect the usage hours by actual users. These standard building schedules vs a more detailed schedule based on measurement can lead to a significant different in the EUI and would be the methodology to get to a EUI of 100 or lower. An example of this difference in proposed versus modeled schedules is shown by the graphs on the right showing a 10% difference between the two.
Ways to continue cutting the EUI
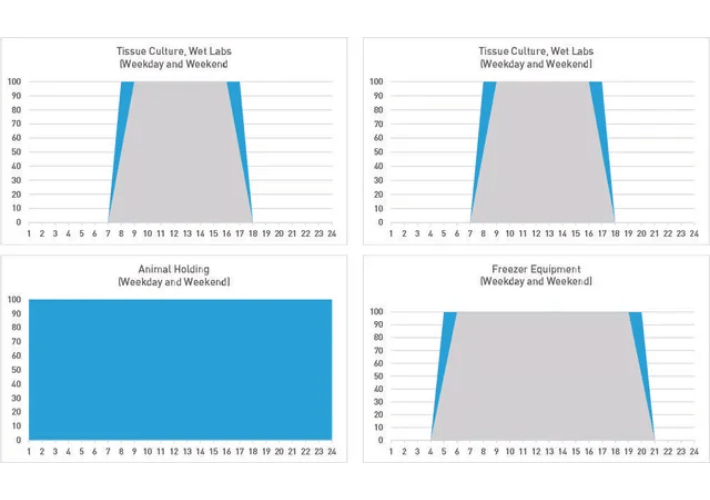
Empty buildings waste energy, 10% Difference in EUI with 1 hour change per day in usage
Is there usage data from HSRB 1? When is the building not used? Are there any months when there will be fewer researchers?
Air Changes, Fume Hoods, Lights, Appliances, Set Points if reduce when building is not in use, we can save significant amount of energy.
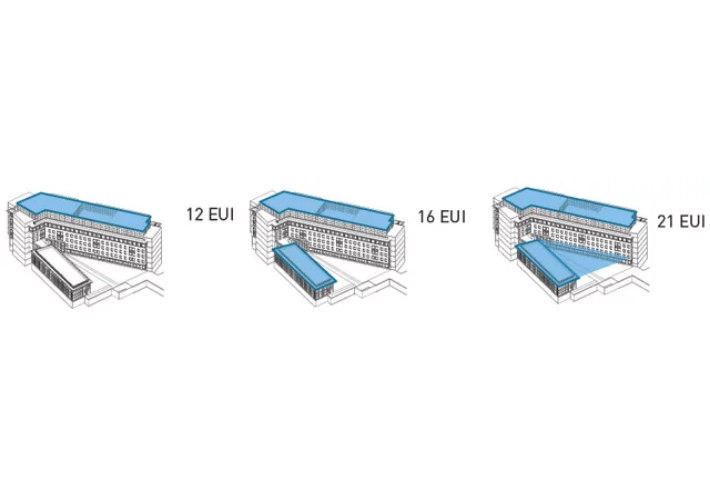
Photovoltaic Study – The diagram below shows the various scenarios of having photovoltaic on the building roof. Diagrammatically they express the amount of EUI these PV can offset based on the building sf. For a building designed at 100 EUI, it can go as low as 84 EUI from the PV on the roofs alone.