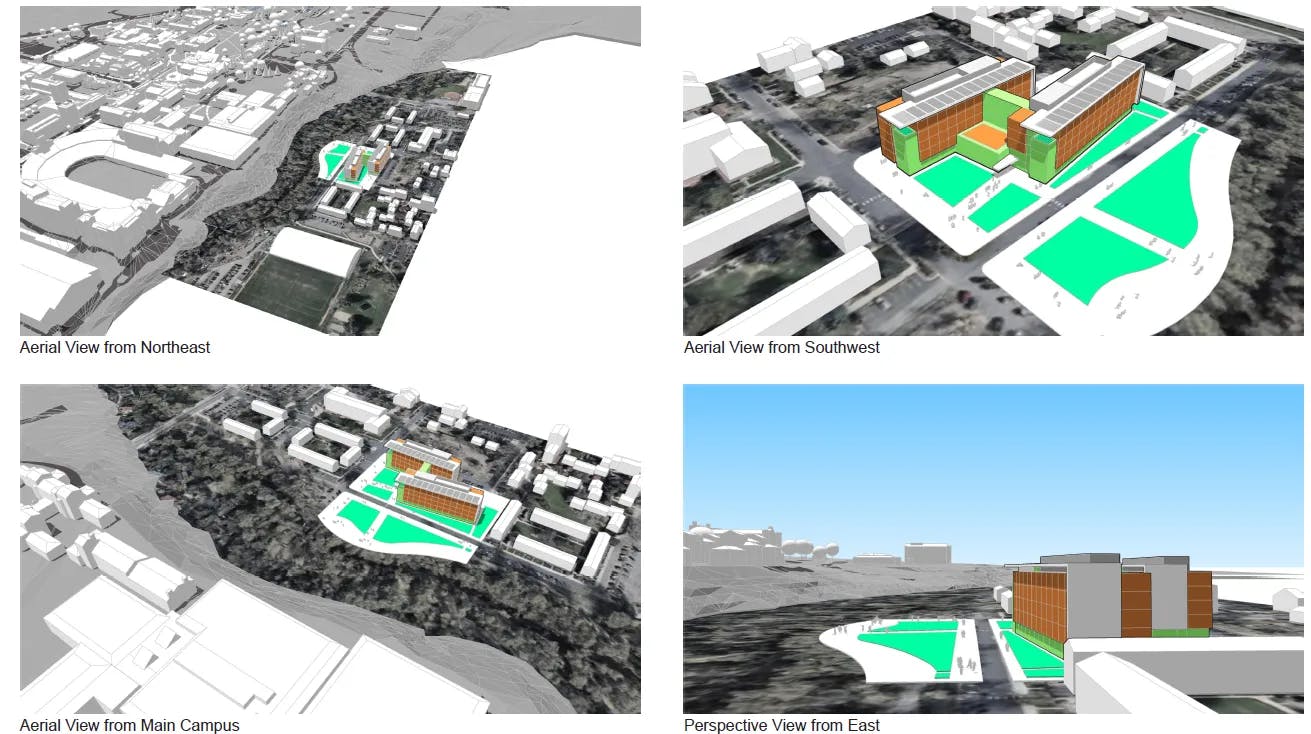
In the fall of 2019, BSA's design team worked with the University of Colorado to imagine an upcoming high-performance student housing project. Following the principles of high-performance design, Josh Vel, Design Director, led his team at BSA LifeStructures to showcase the use data-driven decision-making on the project. Starting in a dynamic charrette process, the team studied site, climate, massing and cost. Early in the design phase, the pace at which the concept evolves is too fast for traditional simulation workflows. The BSA team utilized the automated cove.tool workflow to get rapid feedback.
01 Site and Climate Study
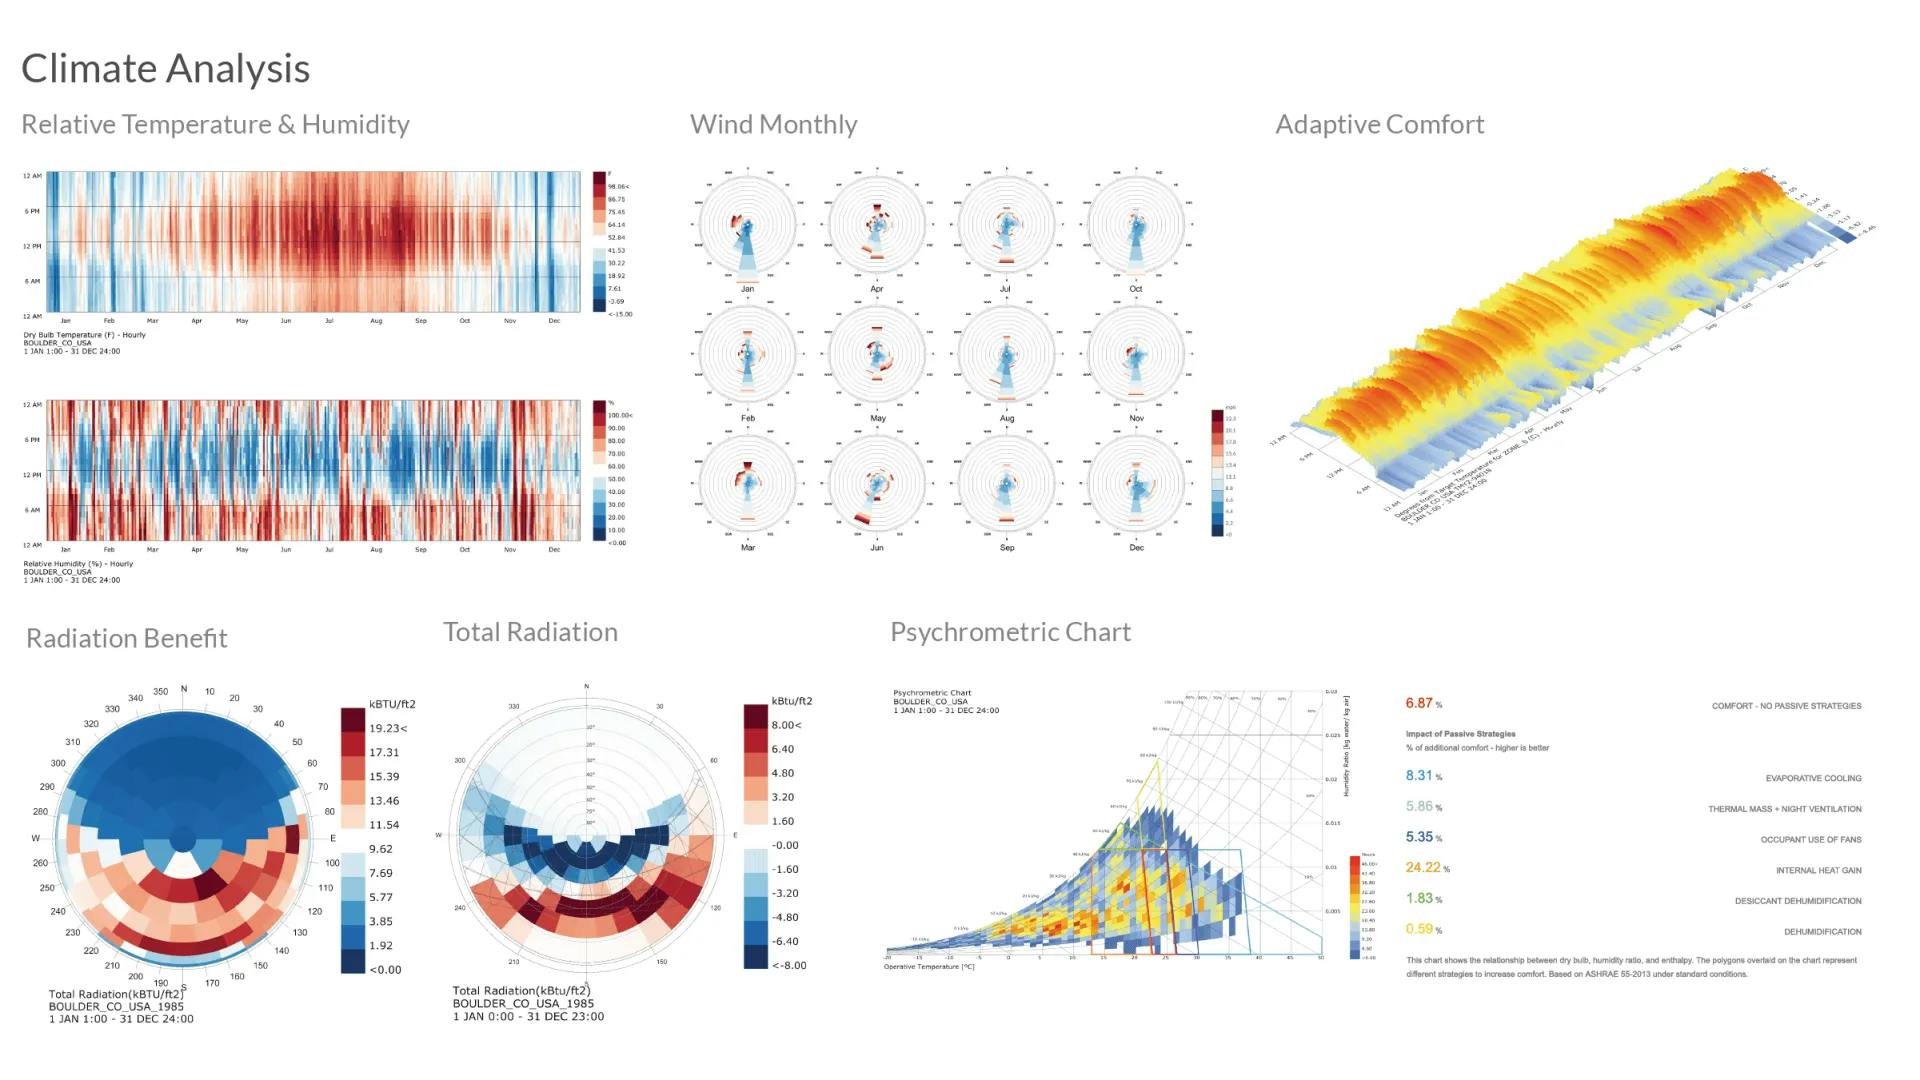
The Boulder, Colorado climate has low relative humidity throughout the year along with mild temperatures during mornings and evening. The psychometric chart showcases that higher internal heat gain would allow the building to achieve comfort 24% of the time without heating or cooling. To take advantage of internal heath gain strategies, the team maximized solar exposure, harvested gains from equipment, and selected window glass with a high solar heat co-efficient (SHGC). Evaporative cooling during the summer months added 8.59% passive comfort allowing the building to be comfortable without passive strategies over 30% of the year. This level of understanding of the existing climate conditions is a critical starting point for exploring concepts that are resilient and high performance.
02 Minimizing Glare, Maximizing Daylight
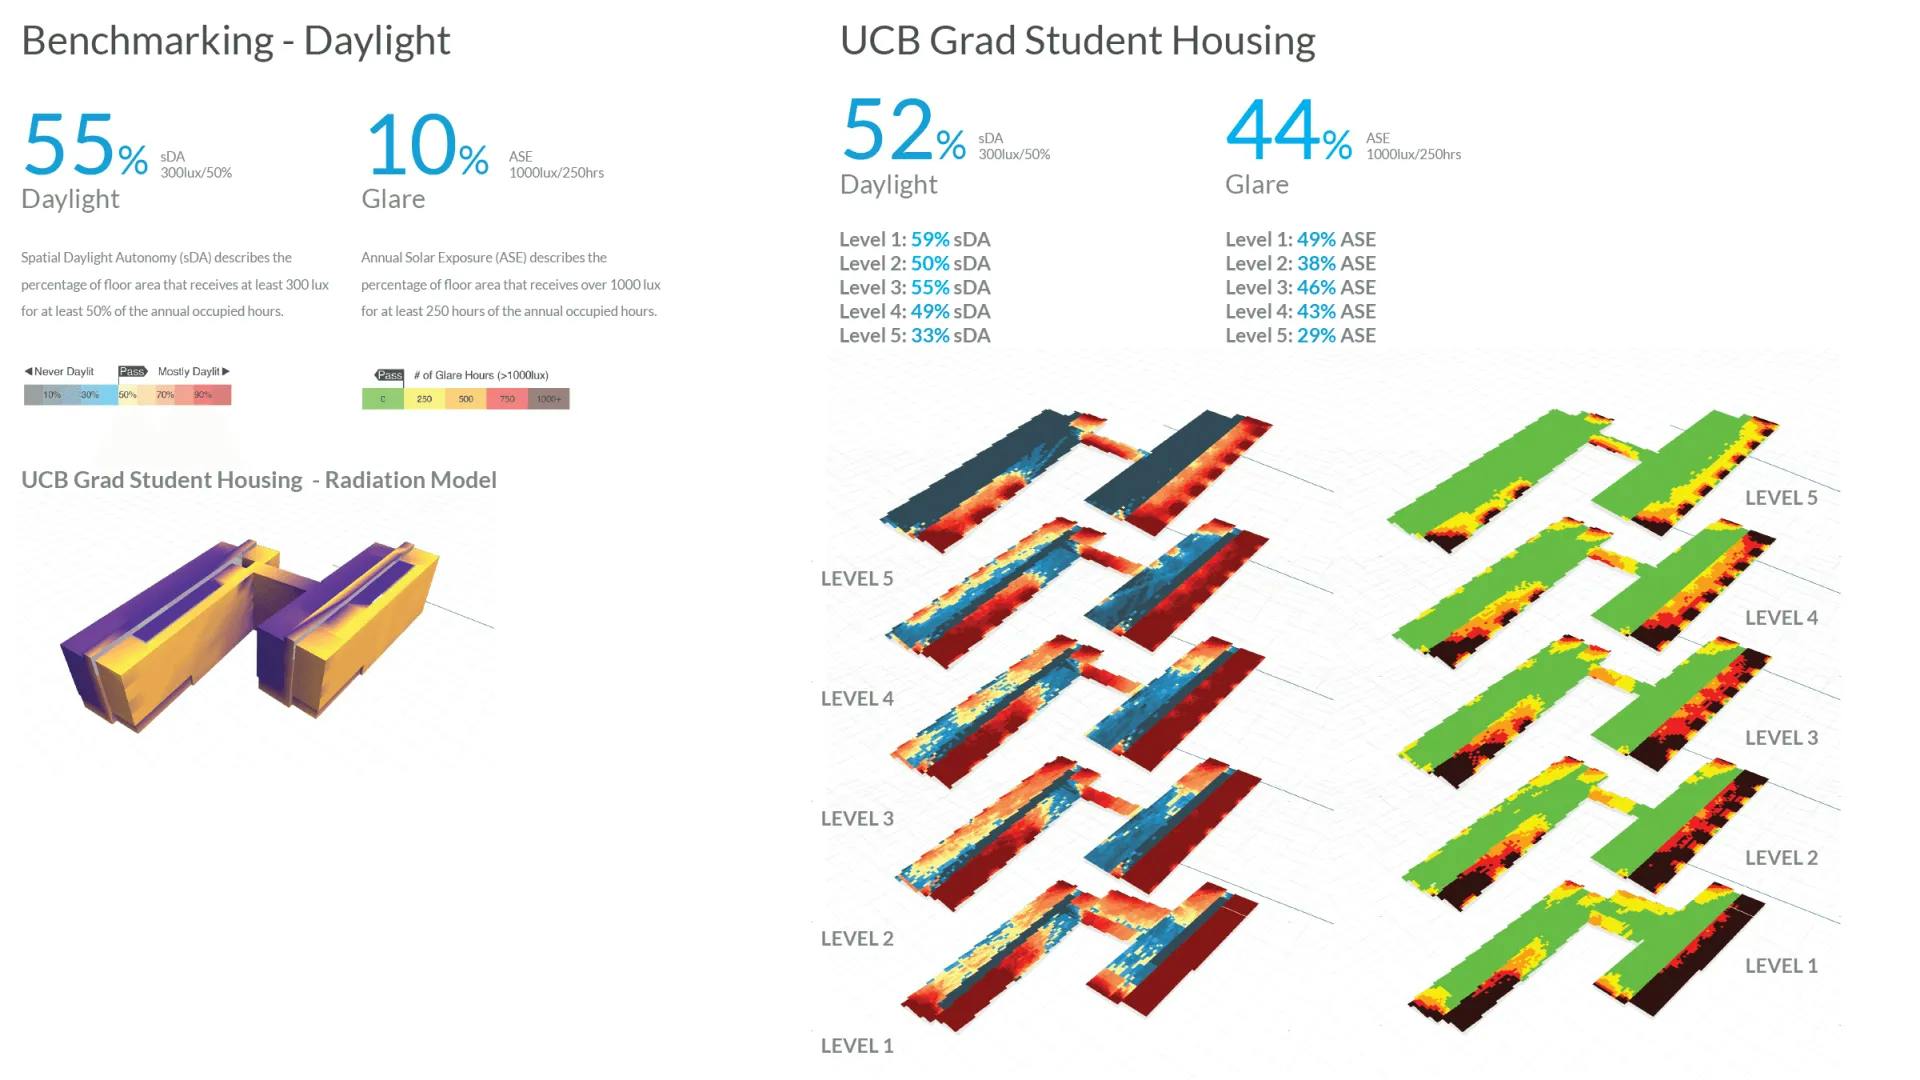
The new student housing is oriented to have the larger facades facing North and South, allowing the design to avoid high glare from East and West facades. The selected massing showcases two bars connected in the middle. As seen in the sDA (Spatial Daylight Autonomy) daylight maps below, the depth of the bars is appropriate to naturally daylight 52% of the entire building. Testing out varying floor depths is helpful in early design, since each 5' of depth can have a major impact on the daylight performance. The ASE (Annual Solar Exposure) glare maps showcase that higher north and south exposure concepts work well. On the left portion of the diagram below, the team was able to study the radiation mapping on the entire massing scheme. This helped the team learn which parts of the facade had higher exposure to sun and best locations for solar. From export in using the SketchUp plugin to getting the analysis shown below, it took just in 18 minutes.
03 Energy, Carbon, and Water Analysis
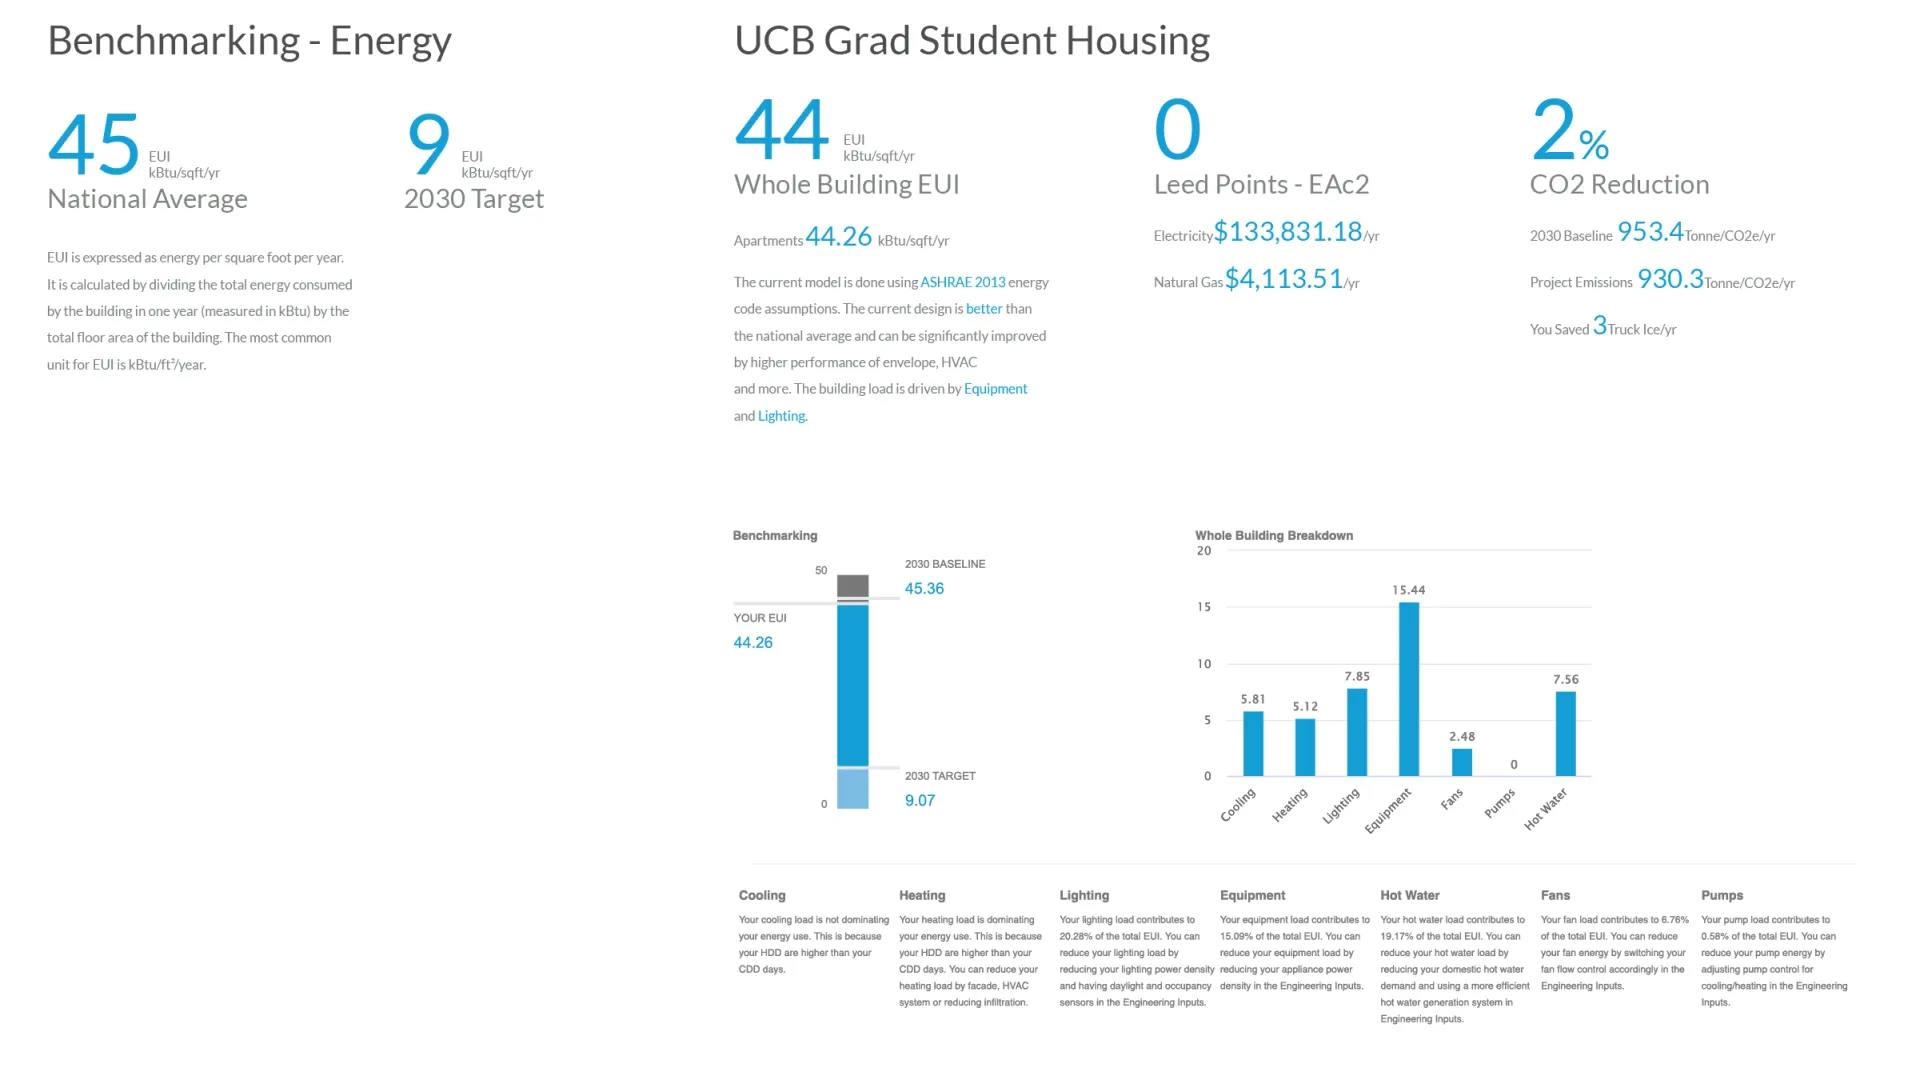
After utilizing the daylight, glare, shadow and radiation studies to optimize the massing for the new housing project, the team moved on to energy studies. Starting out with a baseline benchmark average of 45, the design team targeted an EUI reduction of 25% for 33 kBTU/sf/yr. Starting with the auto-created model to meet base minimum requirements for the local regulations, they calculated an EUI of 44 kBTU/sf/yr. This meant that the team would need to upgrade either the massing, the envelope, HVAC, appliance, sensors or add photovoltaic panels to meet the high performance requirements. The code minimum building showed only a 2% carbon reduction. Hitting the 25% target that would be equivalent to avoiding 37 truck loads of ice melted per year or an entire iceberg. Holistically, the Architecture 2030 DDx target directly highlighted that the team would need to get to an EUI of 9 kBTU/sf/yr to meet the challenge.
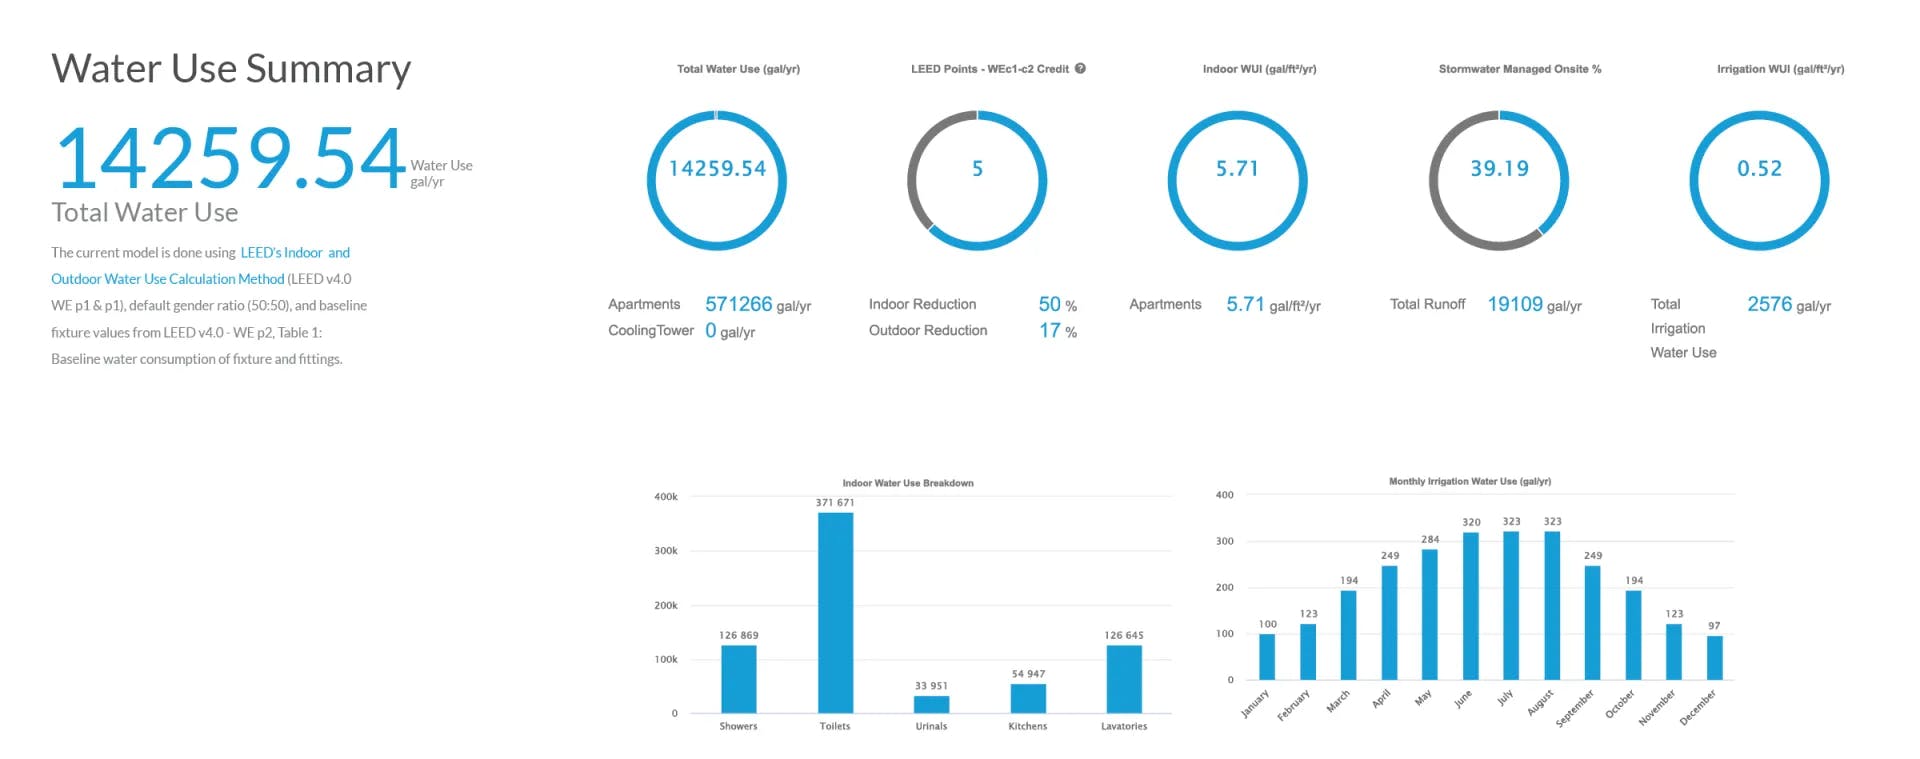
Domestic hot water becomes especially important for housing project with tons of shower, toilets and other water intensive uses. The model revealed opportunities to reduce the indoor water use intensity by using low flow fixtures throughout the project and a potential for grey water use. The diagram below highlights the ability of the design to meet up to 5 LEED points for the water category when using low flow fixtures with toilets since they are the dominant water use load. The team also studied the potential to optimize the landscaping with native plats to reduce outdoor water use and utilizing pervious pavement for storm water management.
04 Parametric Optimization: Meeting Energy Targets within Budget Constraints
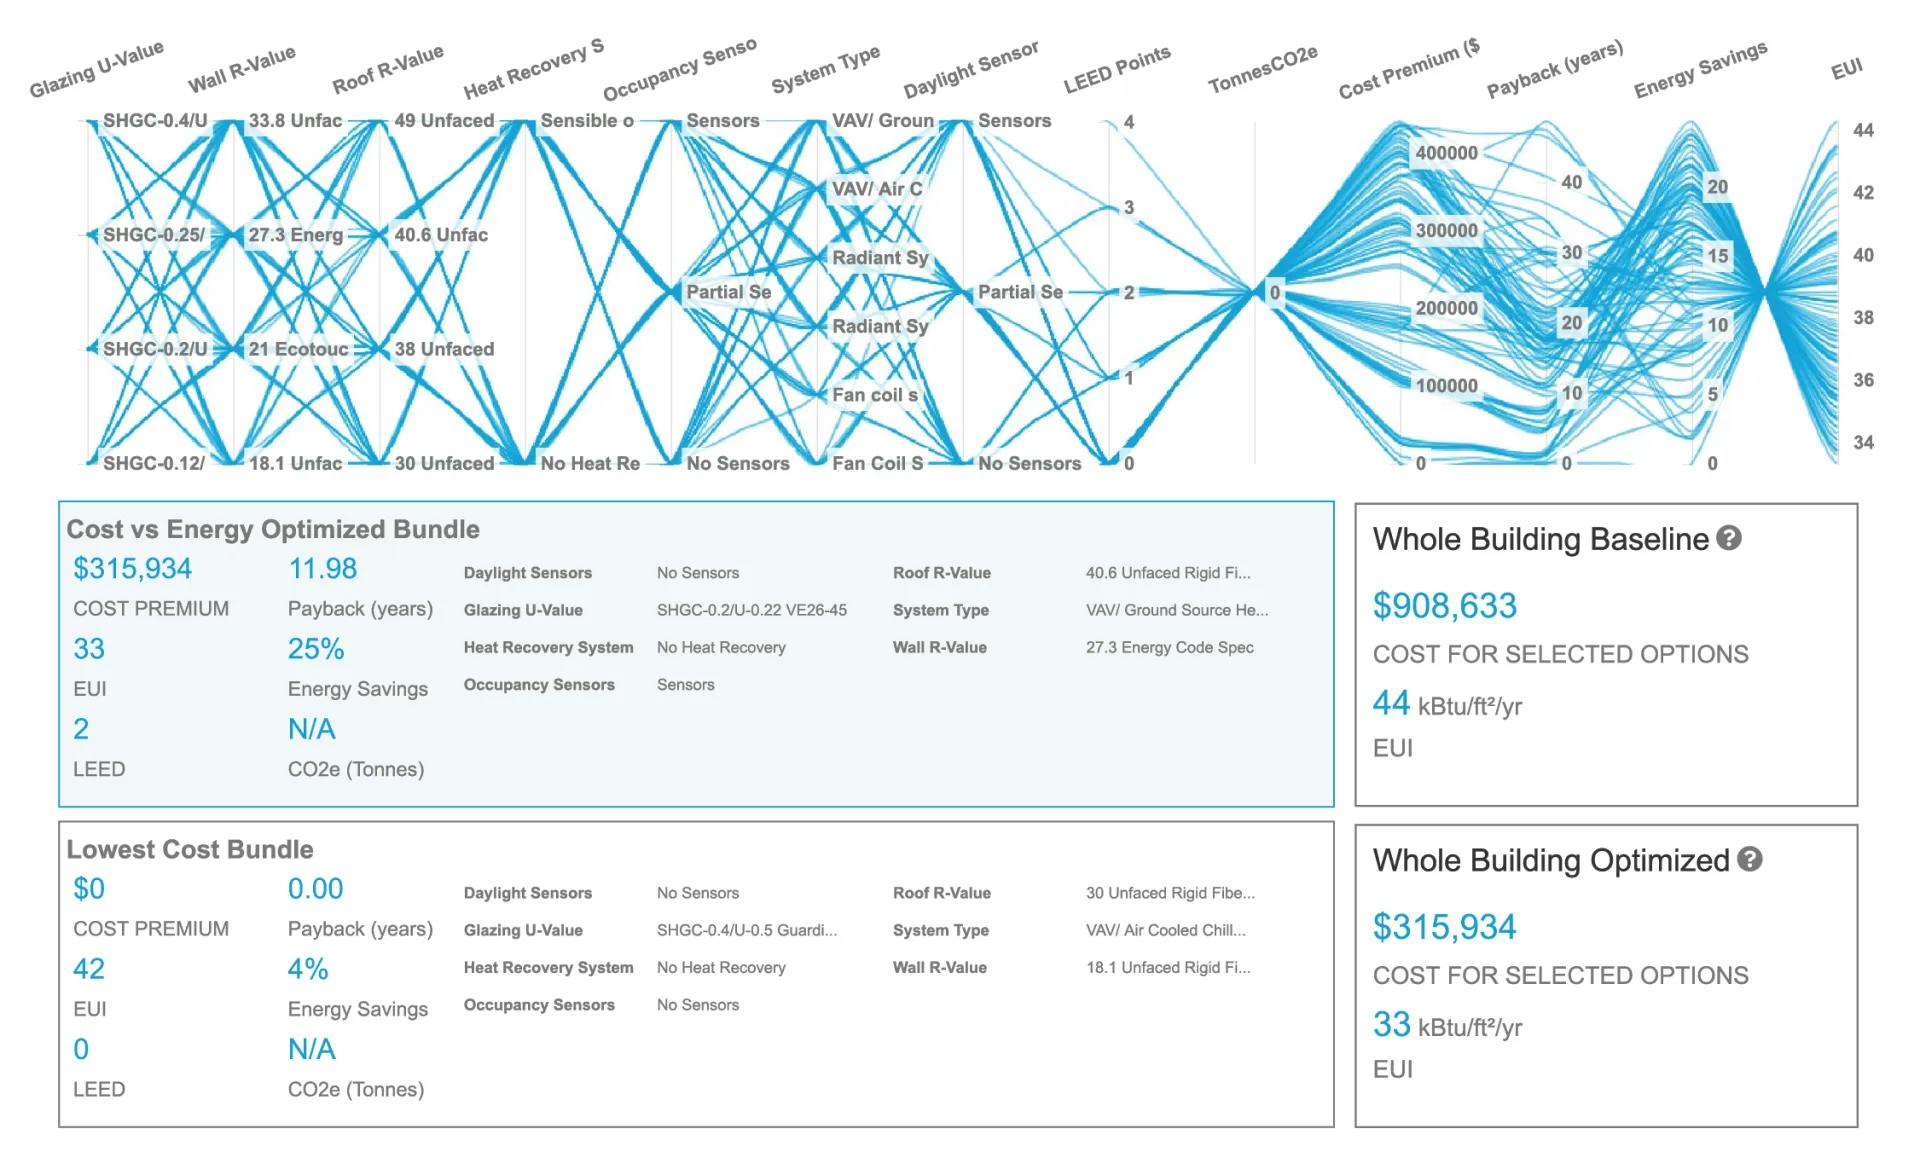
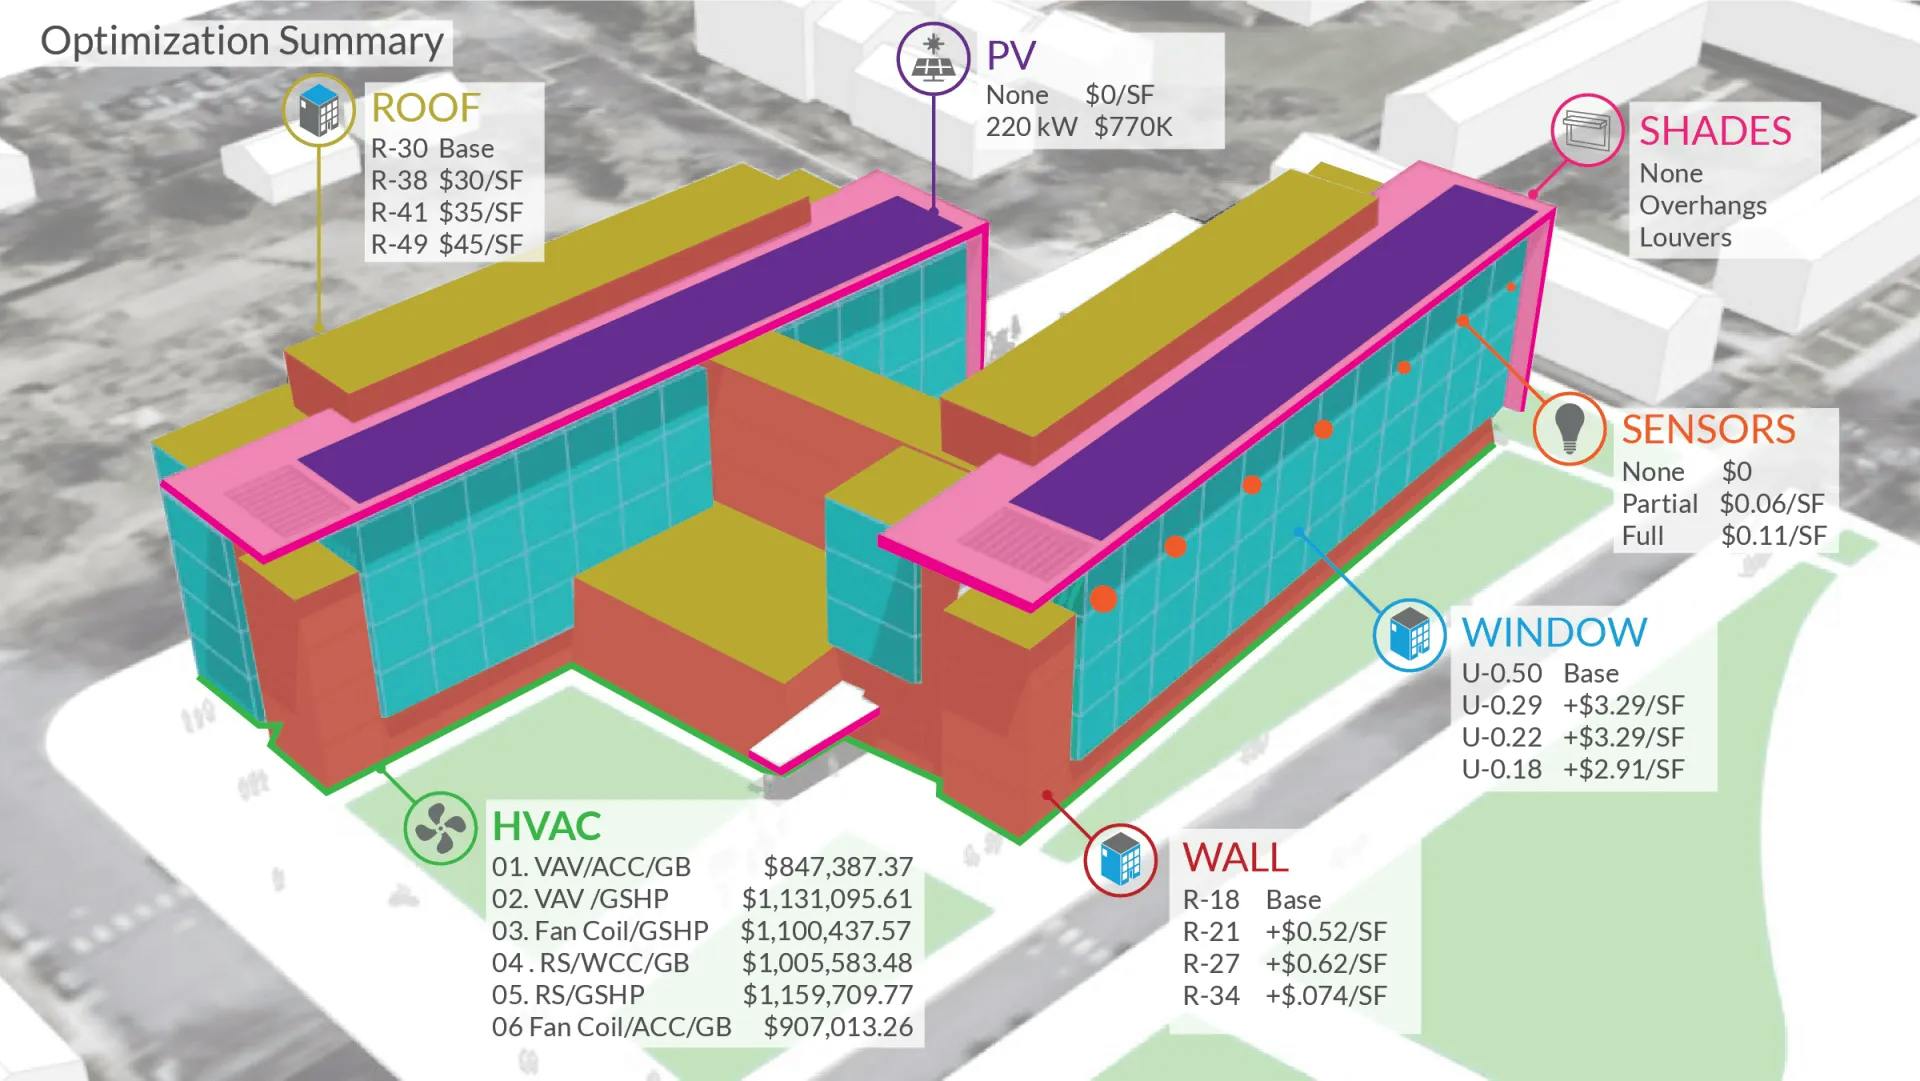
After completing the initial set of building analysis and optimizing the massing, the BSA team studied a range of alternatives to find the most cost optimal way to get to the 25% energy savings and an EUI of 33 kBTU/sf/yr. The parametric optimization allows the team to study a range of alternatives including 4 different roof assemblies, 6 mechanical systems, 2 photovoltaic system sizes, 3 shading strategies, 3 sensor packages, 4 glass types, and 4 wall sections. As seen in the diagram below, not only does each option have a performance value associated with it, but also a cost. The purpose of optimization modeling is to develop bundle recommendations of energy conservation measures (ECM’s) to show various ways of achieving the project’s energy efficiency goals in the most cost-effective manner. These variables utilized for a parametric analysis and an ECM bundling exercise to develop the ‘Optimized Design’ recommendations. In addition to the impact on performance, each variable also had an impact on the project's budget. The holistic cost vs energy optimization allowed the team to study all 6912 combinations and pick the lowest cost one that allowed them to meet the performance targets. Below are all the options that were studied, along with their impact on the project's budget.
In the diagram below, each vertical axis is one possible decision, and each point within the axis is an option for that decision. As an example, the first bar shows 4 glass options, the second bar shows 4 wall options and so on. These option and then balanced against cost, payback years, energy targets and LEED. Of all 6912 options, the team utilized the dynamic slider to eliminate bundles that did not meet the project’s EUI target. As can be seen from the figure below, the cost vs energy optimized bundle allowed the team to get to an EUI of 33 Kbtu/sf/yr with a 12 year payback. The traditional methodology of studying this was to study one alternative at a time, but that leads to inaccurate outputs since every variable impacts every other variable, for example, if we get a high performance glass, we may be able to choose a lower cost HVAC system. It took the team less than 15 minutes to customize their alternatives and run the optimization.