Project Profile
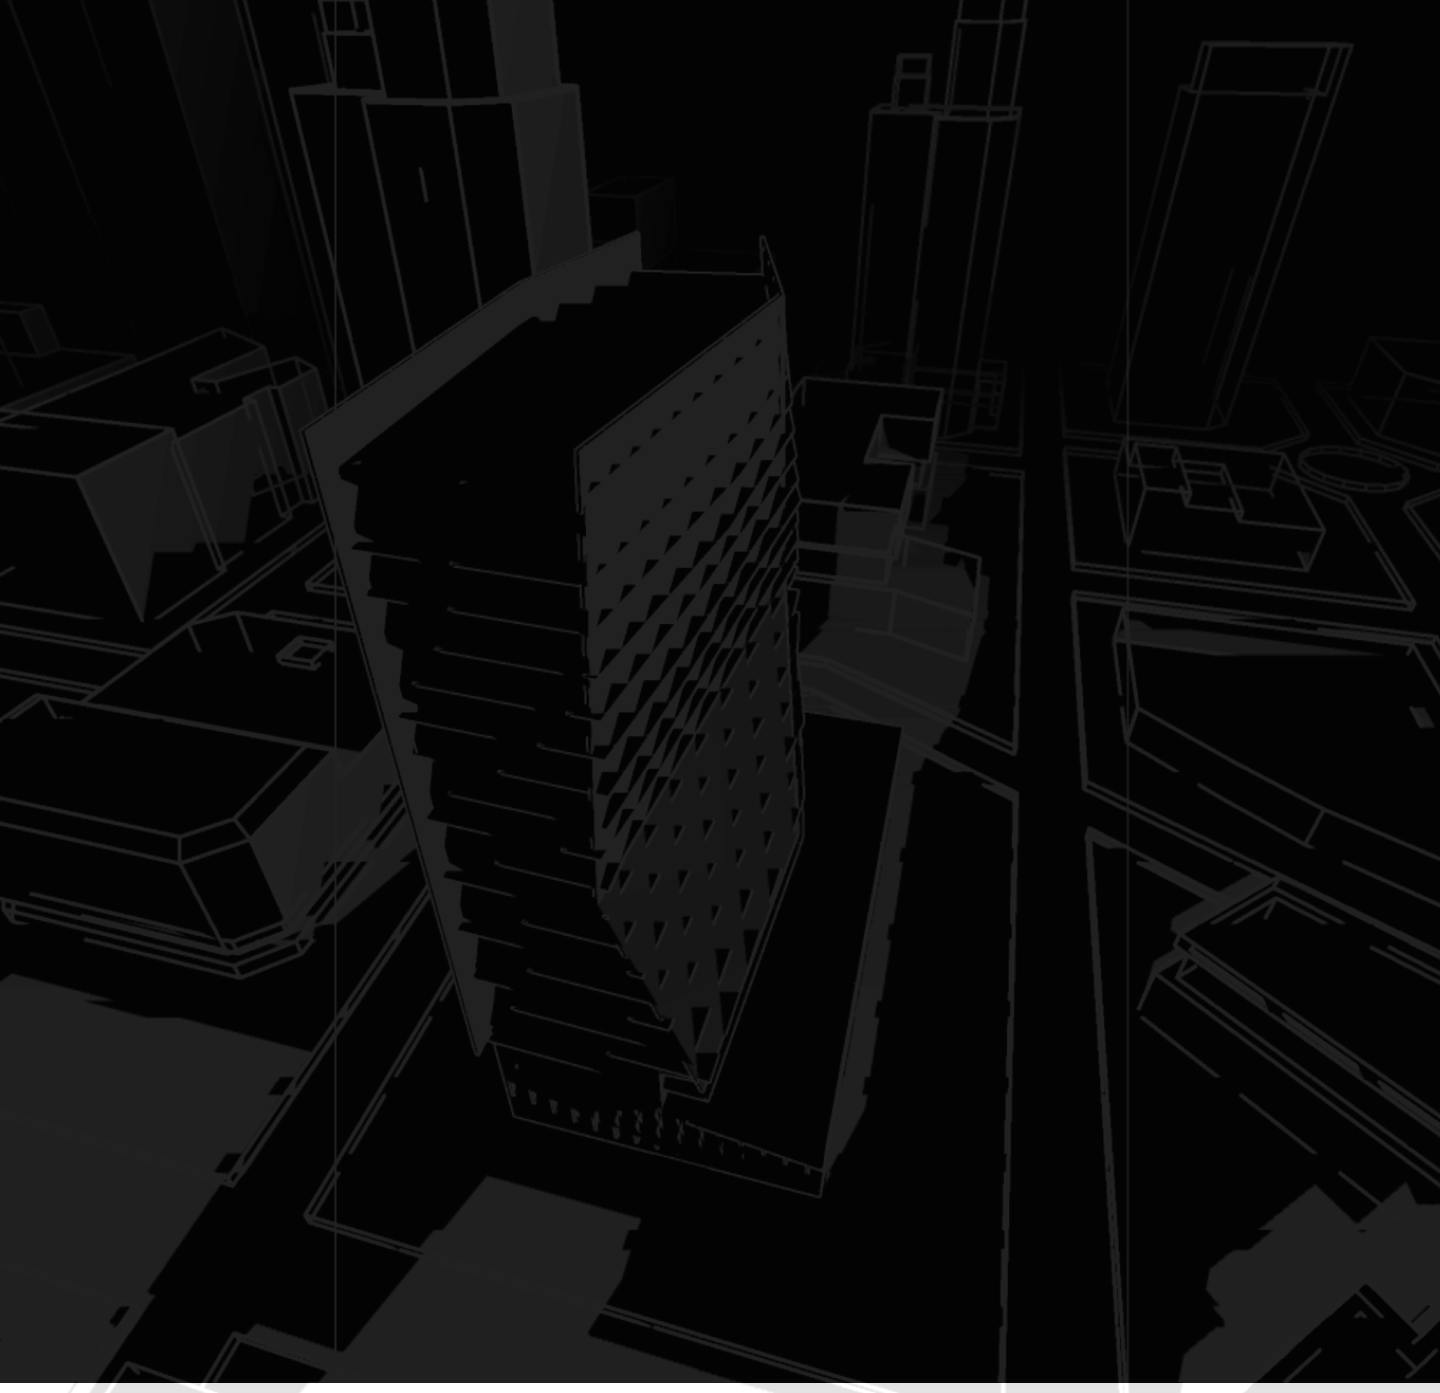
The classroom building is located in Saint Mary’s County, MD, near the US Naval Air Warfare Center and the University of Maryland Unmanned Aircraft Systems Test Site. The 75,000 sf state-of-the-art building has been designed for industry and government partners to collaborate with academic faculty and students on transnational engineering research that grows new jobs in the region.
Setting up Benchmarks
Benchmark for SMHEC
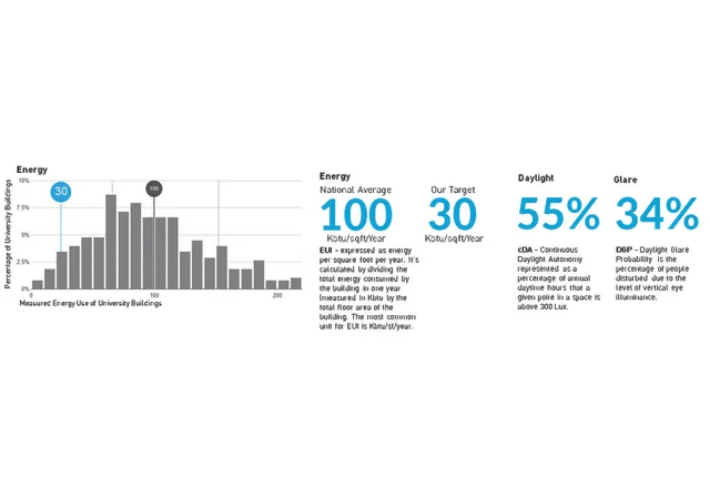
A basic understanding of target values is key to comparing performance design decisions.
EUI – Expressed as energy per square foot per year, knowing the EUI values of design decisions and other iterations, one can get the best value for performance.
Having an initial analysis to determine one stance and set goals, EUI is the best indicator of building performance. The data graphed shows National Average for Higher Education Building EUI 100. The proposed building is aimed to perform at an ultra-low energy use and cost, with our final target being between the low of 29 and a high of 34 for EUI.
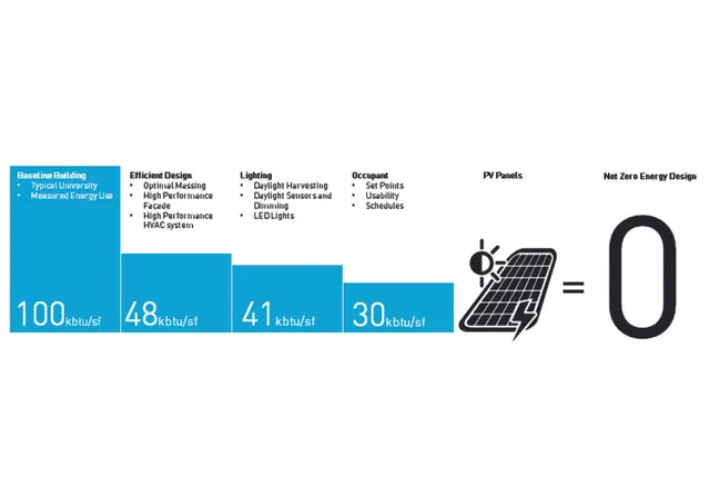
Net Zero Energy Use – Strategies to meet the University Goals.
Understanding the Climate
Climate Data – A basic understanding of the existing climate conditions is vital for making performance design decisions. Optimizing the massing design during early-stage modeling makes sure the building is energy efficient without additional cost impacts. Using a range of climate analysis diagrams to shortlist strategies in terms of building shape, orientation, or glazing percentage collectively correlates to the building’s final energy and cost performance.
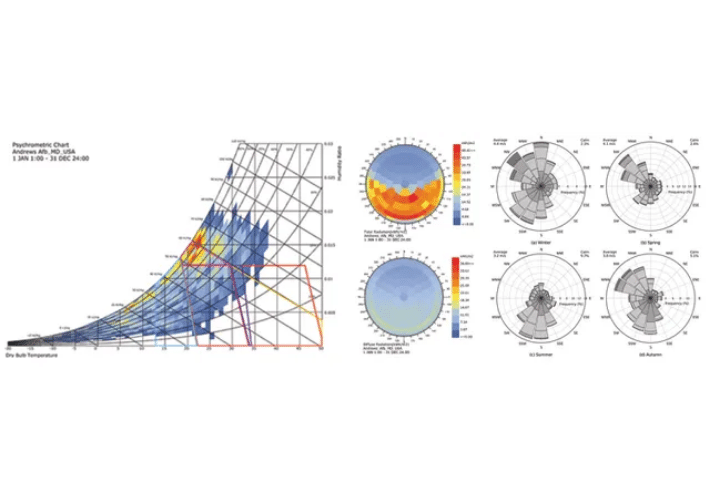
Psychrometric Chart – This chart shows the relationship between dry-bulb, humidity ratio, and enthalpy. The polygons overlaid on the chart represent different strategies to increase comfort. According to this chart, one of the most effective passive strategies for improving comfort in Maryland involves internal heat gain.
Note: The psychometric chart highlights that Heat Stress is 47%, and Cold Stress is 25.4%
Radiation by Sky Segment – This graph maps the radiation onto a sky dome to show the intensity of the direction and intensity of solar radiation on a yearly basis around the cardinal points for Maryland.
Wind Rose – By season Maryland exhibits fairly constant low-speed winds from the west and east. Wind power is not a viable option and little in the way of natural ventilation can be expected. A quick look at the summer graph confirms that there is very little wind during the hottest time of the year.
Daylight Review
Massing Study – The diagrams below show the performance-based decision-making approach followed during the design process. The design team proposed 6 possible massings, each varying in shape, height, and orientation. We modeled each of these massings to compare them for their energy use (EUI)
This is common practice for design teams who do actively introduce energy modeling into the design process. This case study will attempt to compare a side-by-side early-stage energy modeling decision-making process with a parametric one. Here we will begin with Side-by-side daylight and energy massing studies to move forward with the design process.
Energy – to reach the 30 EUI target, the design team first ran energy performance and EUI Breakdowns analysis of each massing proposal to start exploring possible bundles.
Option 1: HUB ALT A – Simple massing familiar to the surrounding site with orientation parallel to campus layout, but has too high EUI and just below adequate cDA.
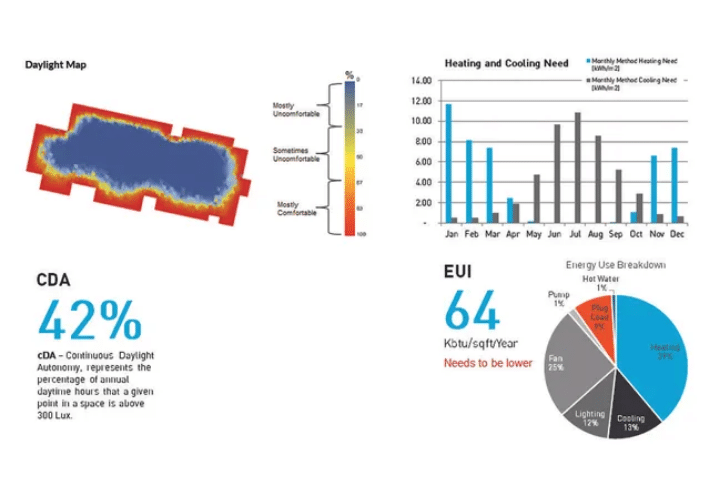
Option 2: HUB ALT B – Simple massing familiar to the site with larger East and West façade, has similar high EUI, nowhere near our 30 target, and I very low cDA.
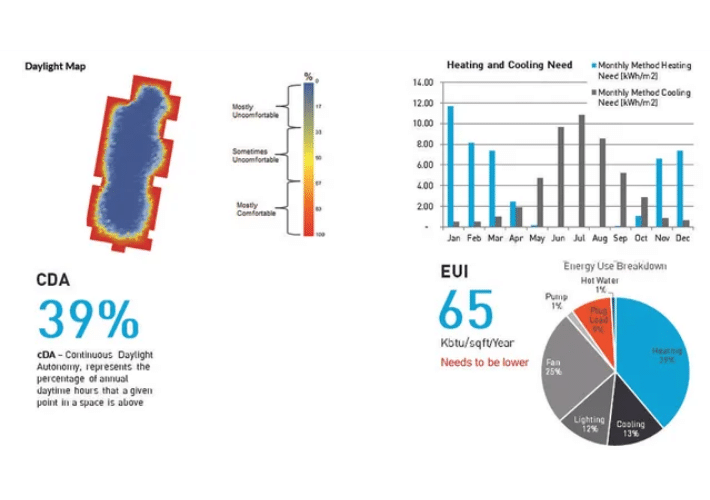
Option 3: HUB ALT C – Simple massing familiar to the site and slanted siting. High EUI and low cDA are not looking good.
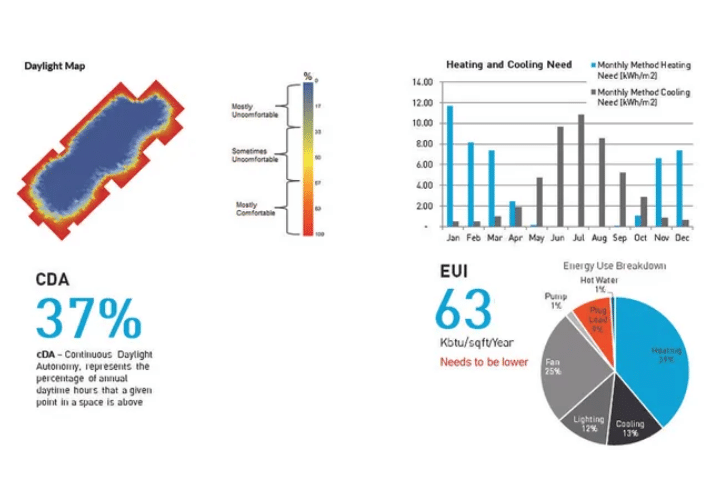
Option 4: Crossroads ALT A – Dynamic massing with lots of façade area. EUI is far beyond the target, which might mean that the benchmark was a bit out of bounds. This massing however proved to have an exceptionally high cDA percentage.
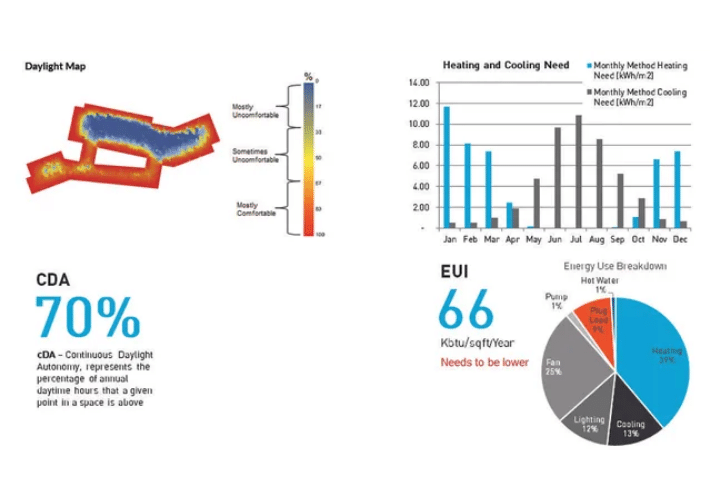
Crossroads ATL B – Similar to last study, but with a slant. However not enough of an impact to do more that slightly decrease the amount of sunlight and not affect the EUI at all.
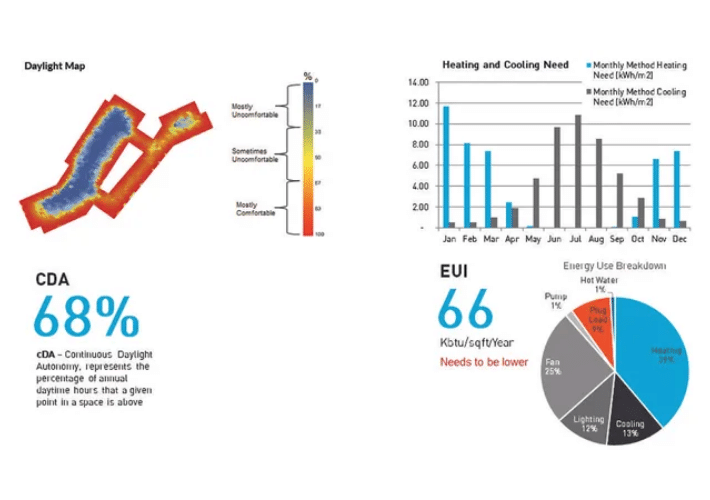
Portal ALT A – Final massing study has a drastically different formal operations, but impact the cDA severely causing it to have the lowest daylight percentage yet same Energy Use value.
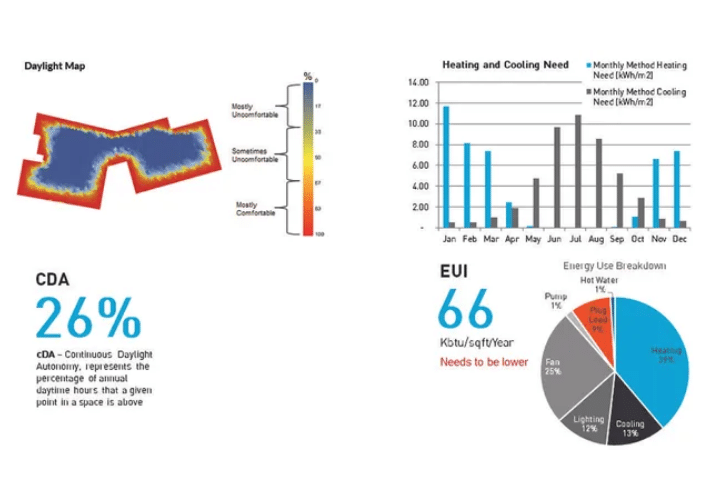
Massing Study and EUI Breakdown – Drawing Conclusions
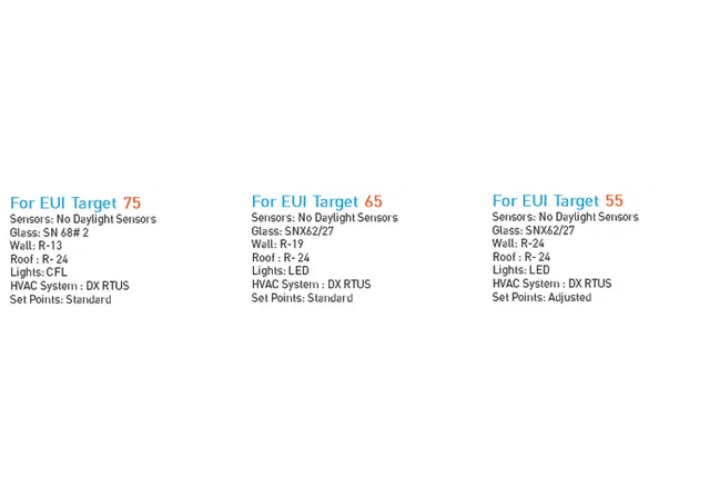
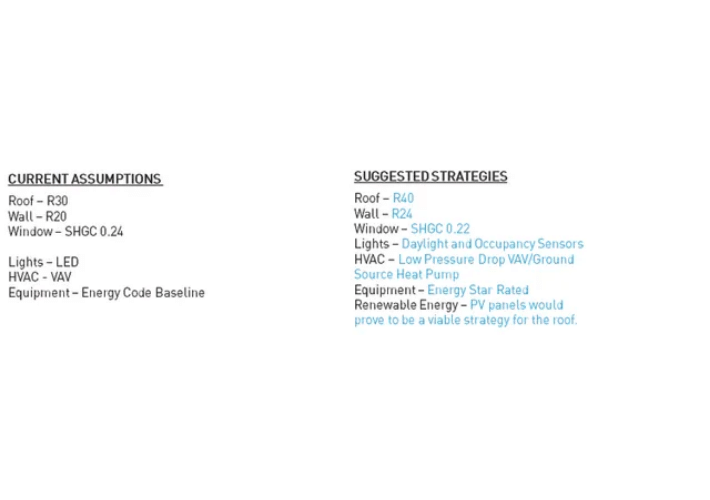
Assumption and Strategies – Often design teams use mechanical systems and assembly values that have proven successful in past projects. Although these known bundles are practiced and constantly passed on from one designer to the next, the combinations are not routinely updated or at all beneficial and should therefore not be practiced as a rule of thumb. Technologies like cove.tool, have advanced the possibilities to compare and intelligently determine which combination of values can best optimize the project's energy performance and cost. Here are the assumptions from which the model was created along with suggested improvements.
Cost vs Energy Optimization
In this portion, the parametric process will demonstrate the advantage of using cost vs energy optimization.
Bundle Summary – Creating the optimal cost and energy bundle. cove.tool allows you to craft your optimization path by allowing you to add and customize the technology/product list. For SMEHC the options and possible combinations are as follows.
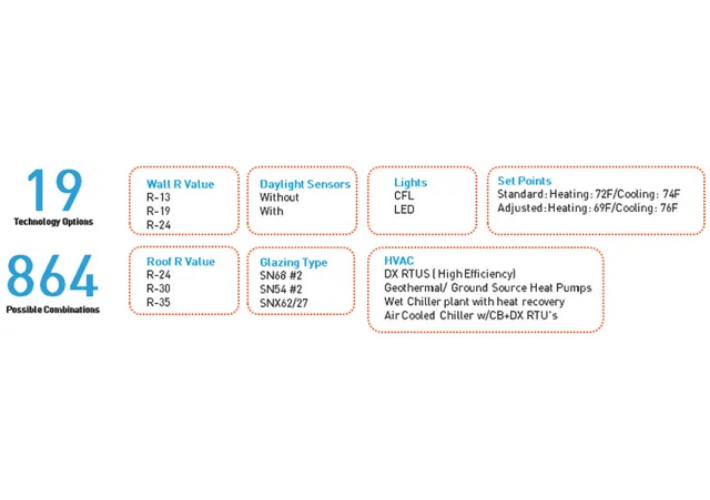
Parallel Coordinates Graph – Below is the base optimization graph which displays the 864 bundle-paths, before any operation is performed. The first part of the graph for the different applied systems parameters, and the second half shows the resulting calculation of the different combinations. As a reminder, the goal of an optimal energy and cost-performing building is keeping EUI low, Operation Costs Low, and Energy Savings HIGH!
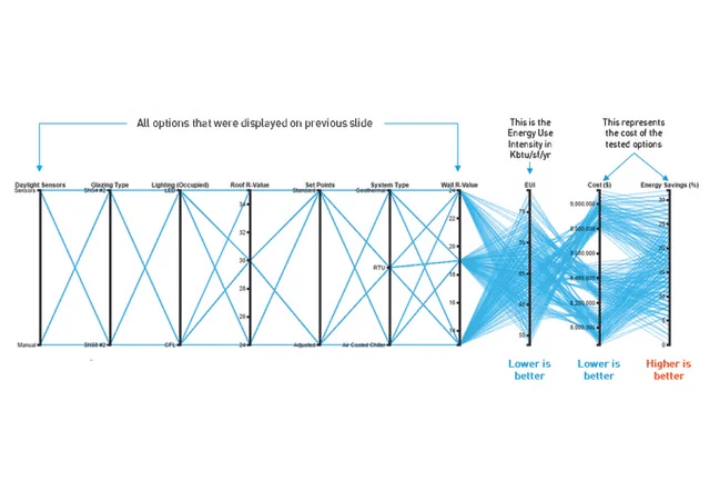
Optimization 1 – The EUI column is targeted to visualize possible mechanical system bundles which will result in a combinations falling in the 74-75 EUI range. According to the graph, the remaining bundles in this target range will be among the lower half of operation costs and energy savings. This is true because a building with higher Energy Use, has less intensive and inexpensive technologies and therefor will not have as much savings.
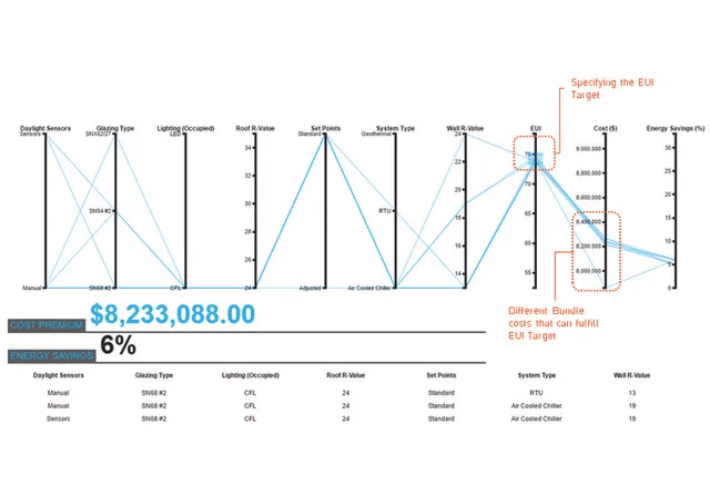
Optimization 2 – A look at the cheapest bundle for combinations in the EUI 75 Range. Highlighted we have the technology options which would allow the design teams to move forward with design options and possibly an advance stage energy model.
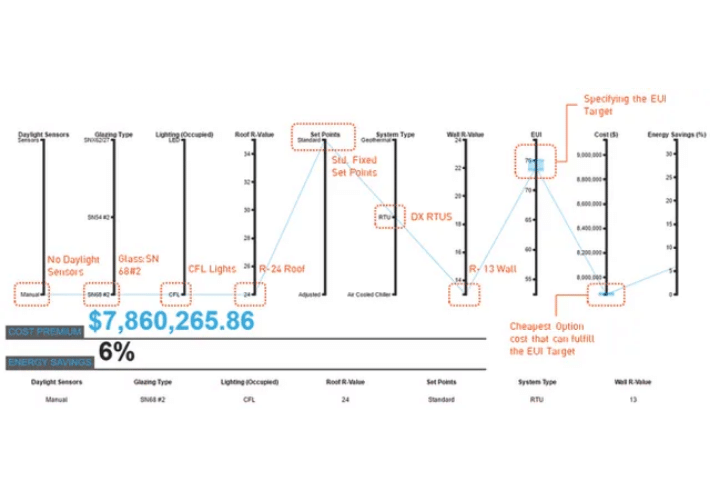
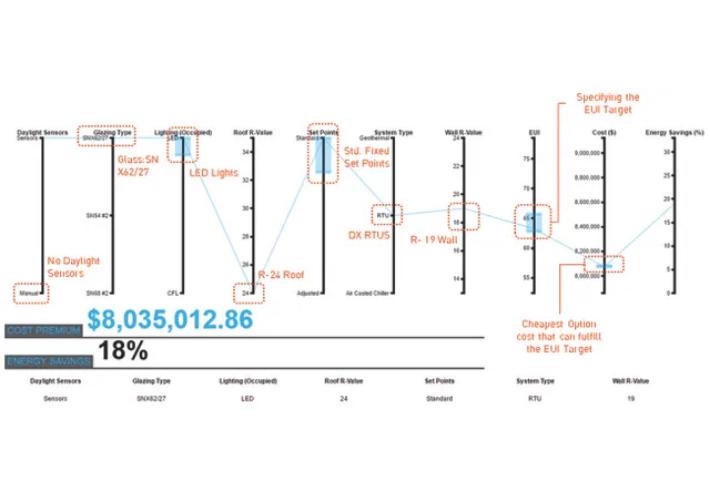
Optimization 3 – Design Team took interest in evaluated technology combinations that where in the range of EUI 65. This Range has a far more diverse operation cost, but rounds out in a 17-21% energy savings.
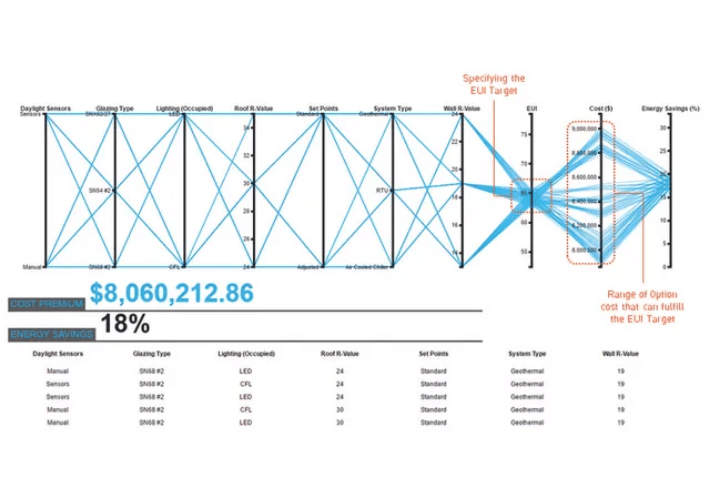
Optimization 4 – Below the path of the cheapest bundle with a EUI target of 65.
Optimization 5 – Once again, the Design Team took interest in evaluating combination paths whose target EUI was 55.
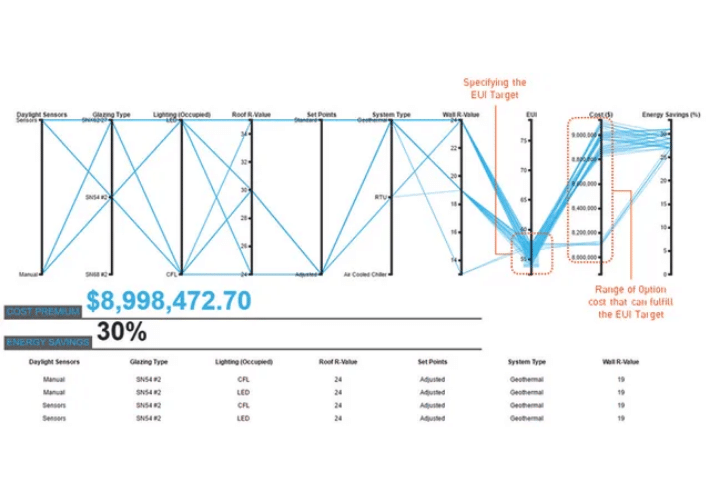
Optimization 6 – Below the path of the cheapest bundle with a EUI target of 55.
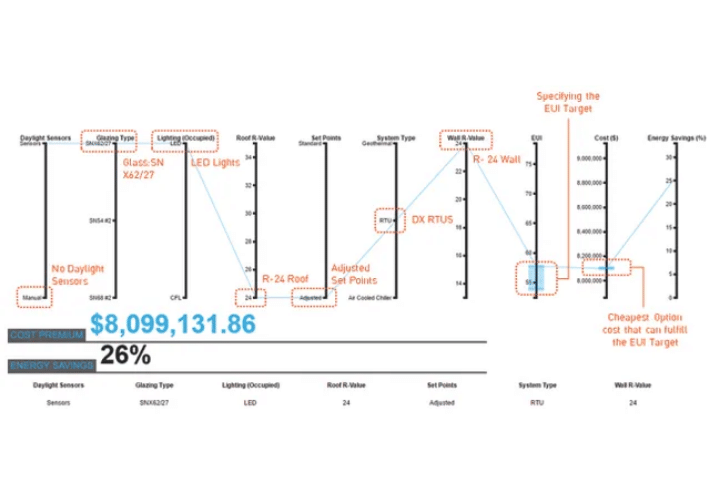
Optimization Summary – These series of operations and studies demonstrate the combination in the range of EUI target 55 has very similar costs to the EUI target of 75 option, but far more energy savings. Thus proving the team could pursue a cost-effective strategy, but have a EUI difference of up to 20 because of the right technologies combination.
