Climate Studies
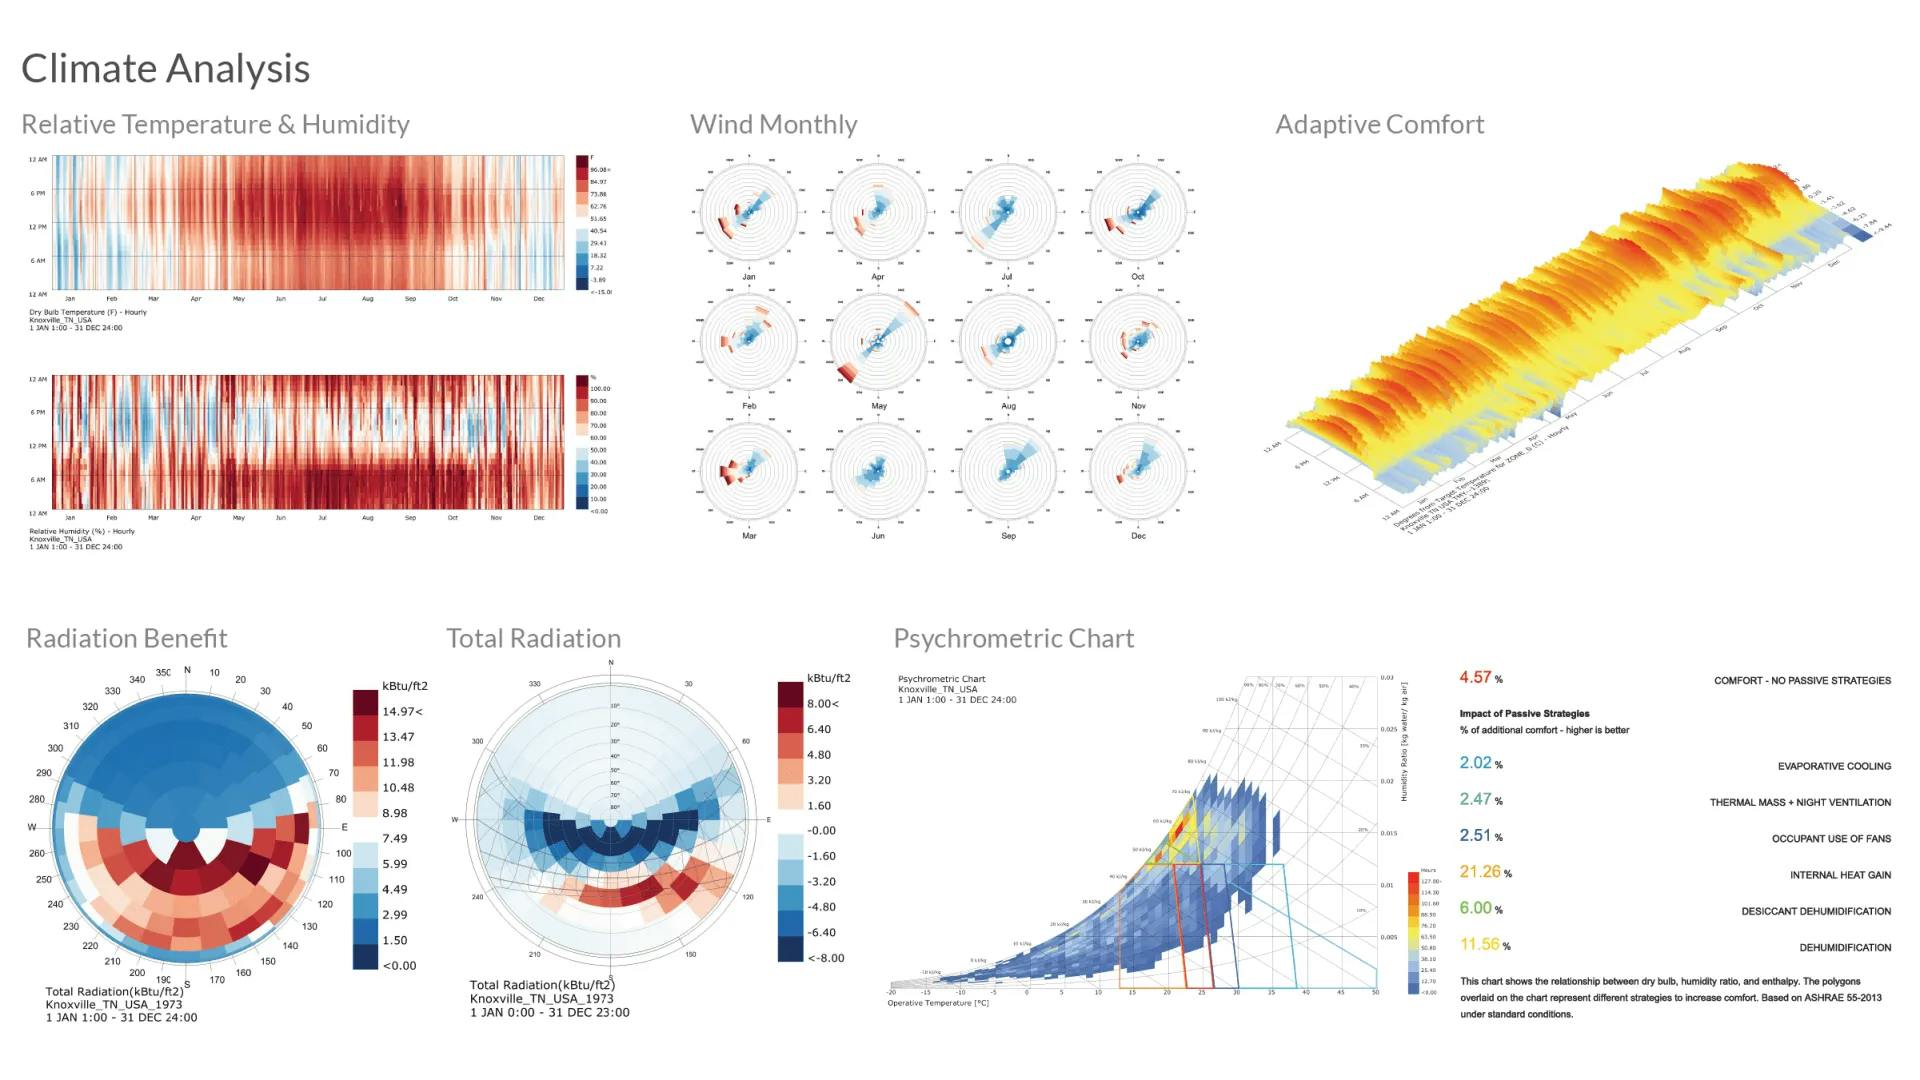
To better understand the context, the architecture team started with better understanding the weather for the mountain community. While it is located in Georgia, the Knoxville weather file was a much better fit and was auto selected for the project using the automated cove.tool platform.
The diagram below features a few types of climate studies including (going clock-wise):
Relative humidity and temperature
This diagram helps understand if natural ventilation is a possibility for the project. In this case, not for the majority of the year.
Wind Diagrams
This diagrams breaks down the wind direction and amount for each month of the year. For example, it is possible to use natural ventilation in February, March, September, October, and the wind direction is North East - South West in those months.
Adaptive Comfort
This adaptive comfort chart showcases to the expected daily comfort profile for your site location. Using this Diagram, one can determine the likely heating, cooling and dehumidification schedule throughout a typical year.
Psychometric Chart
Using the graph, one can determine the number of hours per year a specific physical and thermodynamic condition occurs in a specific climate zone. Each opaque block represents the number of hours where a specific condition occurs.
Radiation Benefit
Also known as the radiation dome, this diagram chronicles the sun angle and solar intensity at which sunlight strikes an area. The Radiation dome is used in the design process to determine how to orient the building, and if the flexibility of orientation is not applicable, where to put the maximum glazing percentage in the project.
