In January 2016, Matthew Early, vice president for campus services at Emory University in Atlanta, faced a challenge. Like many building owners, Emory had selected a great architect and engineer to design a new 110,000-sq.-ft. (10,220-sq.-m.) Campus Life Center (CLC). However, there was no way to understand if the design decisions being made also made sense from the perspectives of cost and energy. With a fixed budget to work with, first costs were rising as the design team labored to meet the aggressive energy targets of the university.
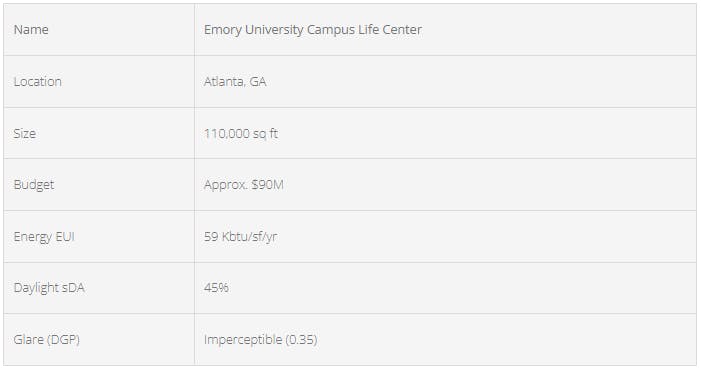
Name Emory University Campus Life Center
Location Atlanta, GA
Size 110,000 sq ft
Budget Approx. $90M
Energy EUI59 Kbtu/sf/yr
Daylight sDA45%
Glare (DGP) Imperceptible (0.35)
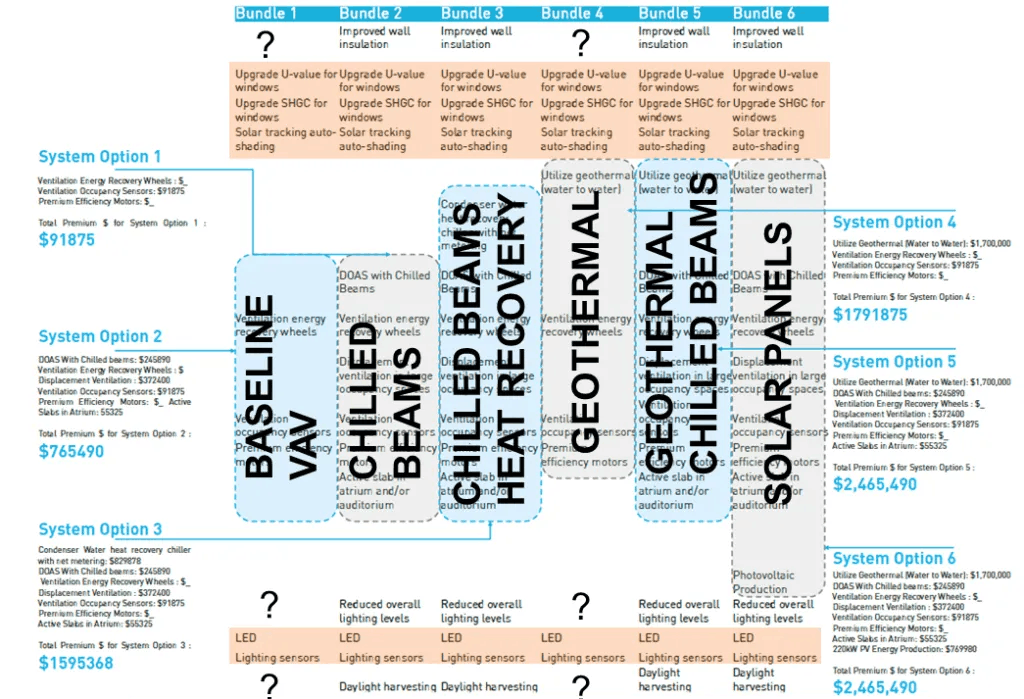
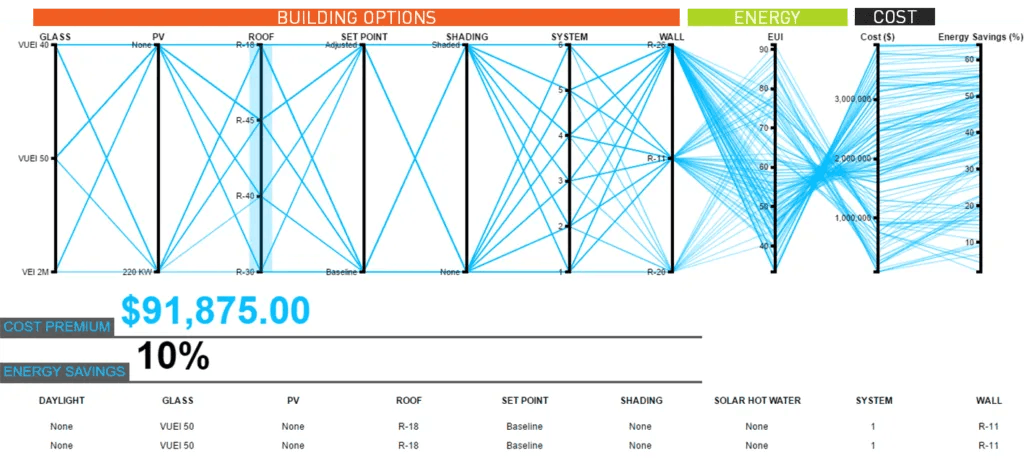
The design team proposed over 100 possible energy conservation measures (ECM), which were then shortlisted to 22 energy conservation measures. These ECM’s were then grouped into 6 bundles to reach the targeted EUI for the Campus Life Center. Each of these 6 Bundles can be seen in the table below. The table highlights the different strategies for each of the bundles. Some strategies are common to all the bundles and have been included in the baseline model. These strategies include, LED lighting and Lighting Occupancy Sensors. Each of the bundles has specific mechanical strategies. These mechanical strategies have been selected to represent different System Options to be analyzed with all the different strategies. The set point adjustment strategy, which appears only in bundle 5 and 6, has been removed specifically from the two bundles, and is tested with all the bundle system options to test if there is a way to get to lower EUI at a low cost.
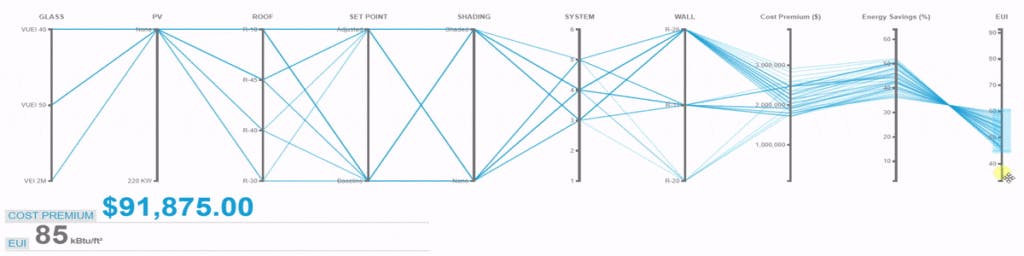
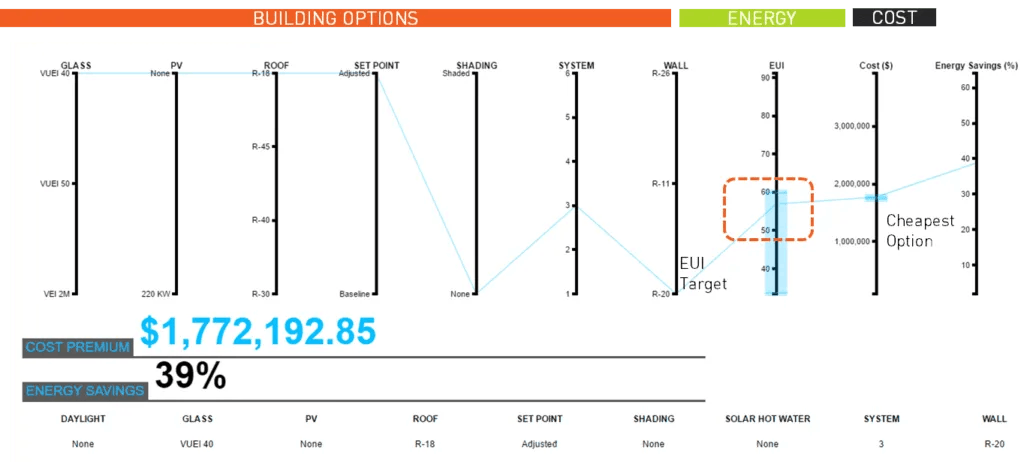
Running the cove.tool analysis on this project saved approx. $0.9M by selecting a more optimal way to meet the EUI target set forth by the team.
Working on this project required a deep understanding of holistic sustainability including energy use, daylight, glare, occupant comfort and life cycle cost. The team got involved in this new construction during schematic design with the goal to create a cost optimal high performance solution. They worked closely with the owner, architect, contractor and mechanical engineer to run a unique cost vs energy optimization and pick out the high performance strategies that were giving the highest benefit for the cost.
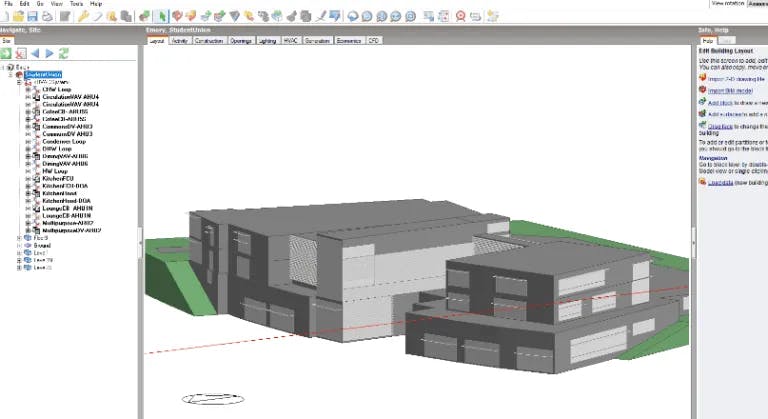
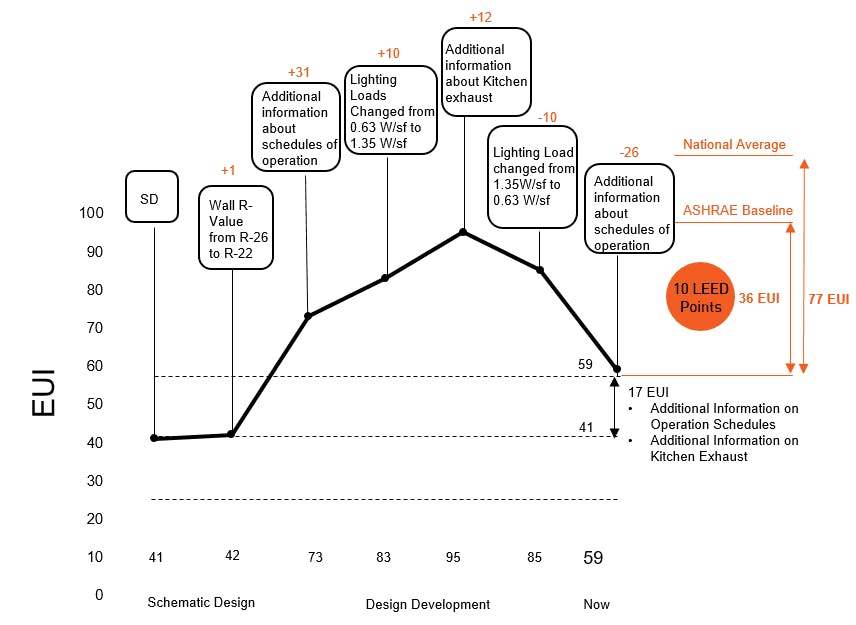
Further, with the selected strategies the team created both an energy model using both cove.tool and Design Builder (with the EnergyPlus Engine). The two models were done in conjunction as part of a study to test out the outputs from cove.tool and see how they compatred to the Design Builder model. The design team used this energy model as a tool throughout the design process to test changes to the design. The graph below shows how they tracked the energy use of the project with every design and engineering decision made on the project.
The table below outline the various inputs that were used for the creation of the energy model using the two different software, DesignBuilder and cove.tool.
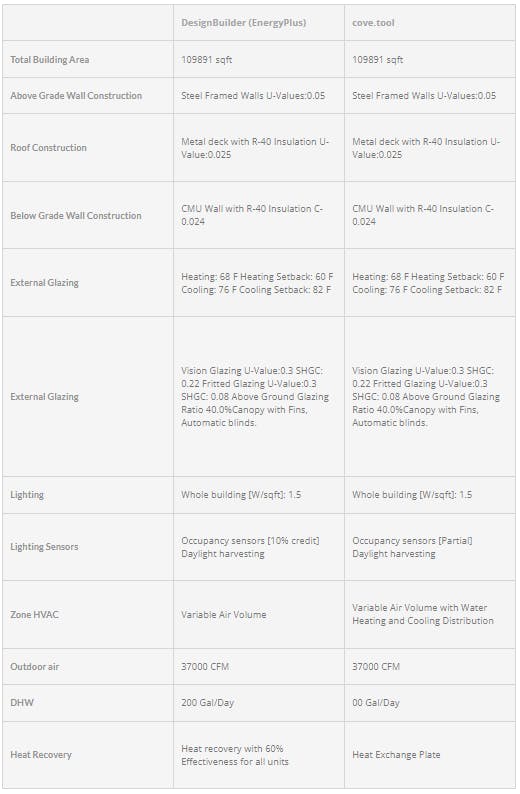
When running the same model on the two different software the following observation about the energy use were made.
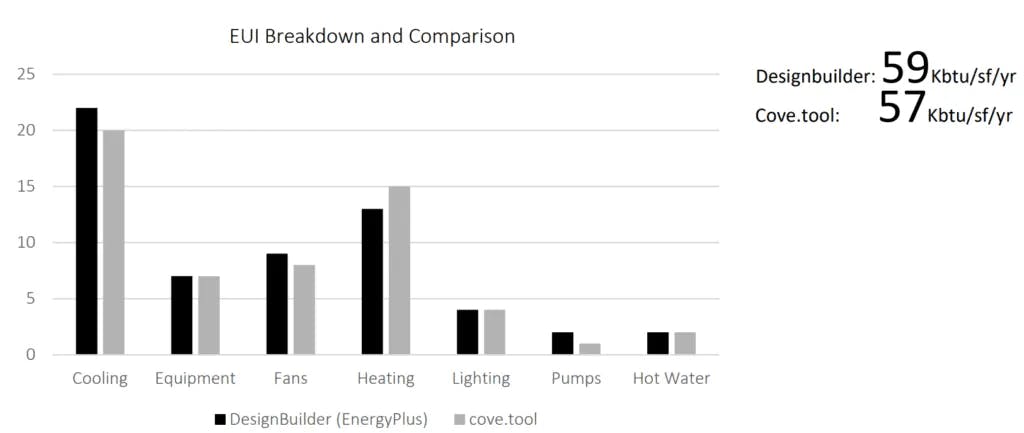
Running the two models, there was very little surprise that the equipment, lighting and hot water loads matched exactly between cove.tool and DesignBuilder since they use the same methodology for the calculation. The heating, cooling, fan and pump loads can sometimes vary between an early stage parametric modeling software and a detailed HVAC sizing simulation. Despite these change, overall both the models suggested similar outputs, varying by approx. 2 EUI.
On the whole, it is important to remember the purpose of running the model. No energy model can give the designer, engineer or owner a prediction of the future, but good models can certainly help making better choices through the design process. It is for the purposes of enhanced decision making, that cove.tool becomes vital to every project. While the team was able to update their easy and fast cove.tool model with every design change, they were only able to do so a handful of times with the detailed Design Builder model. The team utilized cove.tool to run through thousands of iteration to find the most cost optimal way to get to t he performance targets and then used the outputs from cove.tool for the compliance level modeling complated in Design Builder.