With the recent AIA resolution (for energy efficiency), more efficient energy codes, targets like LEED, AIA 2030, Living Building Challenge and so many more, “sustainability” has become part of the job for a designer. Although it is now the assumed part of the job, there is still limited education on how to make performance a part of your design. cove.tool is helping many of your contemporaries with just that. It actually enhances your design skills by not only assessing your design but providing bite-sized learning. Here are 3 examples of how.
You’ll learn about your building’s performance metrics on the spot
This means you will never walk into a project meeting without performance data for your design.
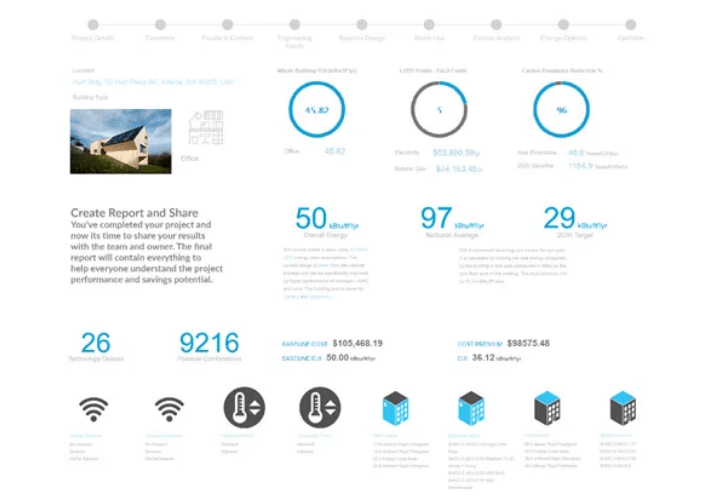
cove.tool is the number one early-stage tool because of the vast array of results our users receive at the end of every run. In 3 easy steps, cove.tool users can go from a conceptual model to knowing their project’s projected EUI, energy use breakdown, CO2 Emissions, Water Use, Benchmarking, etc. Every report contains some of the most important factors needed to make the critical decisions during early design. Also, unlike other tools, once you’ve generated your first report, the hard part is over. Users can go back and forth and continue to change and create project copies. This makes comparing design options a breeze and helps demystify the impact of input changes make to users who haven’t studied in the field before. By your tenth project, you will have a grasp of project variables and will be able to move forward to an end-stage BPA tool and know exactly which inputs will have the best return for your building’s performance.
You’ll learn about the efficiencies of various building inputs
The traditional model, where architects send the design over to the engineers and wait two weeks to understand its performance, is over. Designers can not only be in control of the process but also learn what’s driving the energy and what they can do to reduce it.
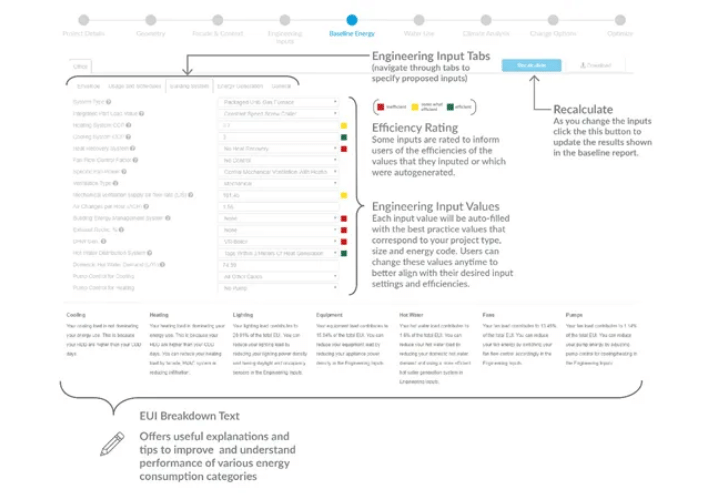
cove.tool shows efficiency ratings for various project inputs. Having these 3 key features 1) a color-coded rating system, 2) help text directly identify possibilities for improvement, and 3) Real-time side-by-side inputs and results display; users will quickly get the hang of how different factors integrate to build your projects performance profile and what strings you’ll need to pull to start your project on a high-performance track.
You’ll learn that the “best choice” does exist, and how among an ocean of factors, weighing solutions can be quite easy
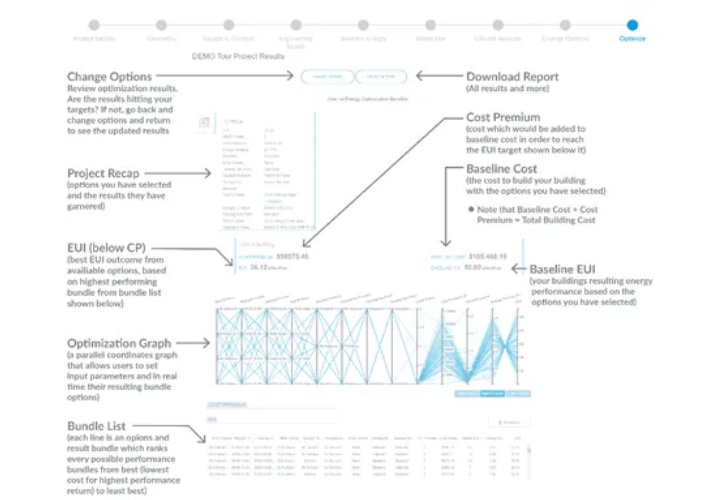
The Optimization page is the tool you’ve been asking for since you entered the world of decision-making tools. With just 16 categories and 3+ options per category, a single project can have thousands of possible bundle options (3,360 permutations minimum). No person has the time or stamina to look through all that complexity. How do we solve this problem? Optimization! cove.tool uses a parallel coordinates graph that allows users to set input parameters and in real-time see the possible bundle combinations. Features built into this interactive diagram include payback period. The diagram above shows how the tool searches to find the peaks and get users solutions that maximize energy savings while minimizing cost.
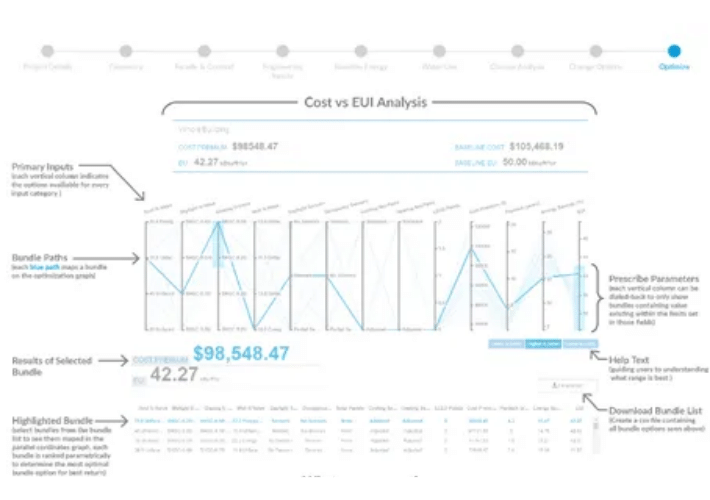
Below the Optimization graph is the Bundle List, which ranks every possible performance bundle from best (lowest cost for highest performance return) to second best, third, and so on.
ECM Bundle that will hit the EUI target of 30 kBtu/ft2/year.