Table Of Contents
- What is Whole Building Energy Modeling?
- What is Included in a Whole Building Energy Model?
- What are the Results of Whole Building Energy Modeling?
- What is a Site Energy Use Breakdown?
- How to Interpret a Site Energy Use Breakdown
- Beyond Energy Results
- Wrapping Up: Key Takeaways from Whole Building Energy Models

What is Whole Building Energy Modeling?
Whole Building Energy Modeling, or BEM, is a flexible, highly capable tool used in the design of new and retrofit buildings, code compliance, certifications, incentive programs, and more. At its core, BEM is a physics-based simulation of building energy use. Through advanced software, these simulations are performed with sub-hourly timesteps, providing a considerable amount of insight into the performance of the simulated building.
What is Included in a Whole Building Energy Model?
A BEM includes a great deal of information about the building and project. Depending on the goal of the BEM, varied amounts of data are required. ASHRAE Standard 209 provides requirements organized into cycles based on the simulation's goals. Some cycles require low levels of detail and rely heavily on standard assumptions, while others require documentation of the complete building design. Common inclusions for a BEM are weather data covering 8760 hours per year, hourly variations of internal loads, representation of all thermal zones, and models of the HVAC systems.
What are the Results of Whole Building Energy Modeling?
There are hundreds to thousands of results from a Whole Building Energy Model. Each represents a specific energy use or source within the building. Other results will report point-in-time heating and cooling demand or load for the entire building or specific zones. Each result will include 8760 data points, representing the 8760 hours of the year. Let's look at some of the common results and how they are used.
What is a Site Energy Use Breakdown?
A Site Energy Use Breakdown is a summary of the energy consumed by a building or facility, typically segmented by end use (e.g. heating, cooling, lighting, etc.). This information can help identify areas where energy efficiency improvements can be made and track the impact of energy conservation measures over time. The breakdown can be presented in a variety of ways, such as in a chart or graph, and can be reported on an hourly, monthly, quarterly, or annual basis. ASHRAE Standard 90.1 is a commonly referenced standard for energy code compliance in the USA and throughout the world. The standard addresses various aspects of building design and construction, including site energy use breakdowns. The most typical breakdown components are:
Heating
Cooling
Heat Rejection
Heat Recovery
Service Hot Water
Pumps
Fans
Lighting
Equipment
While other components, such as humidifiers, can be present in some projects, the above list provides an excellent overview of a project's energy performance.
How to Interpret a Site Energy Use Breakdown
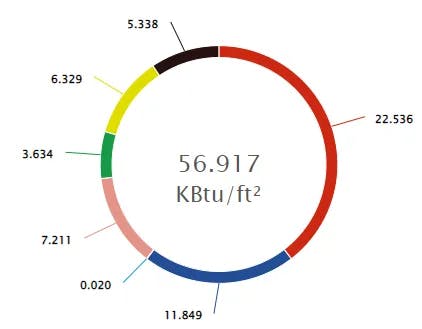
Site energy Use Breakdowns are helpful to view from both annual and monthly perspectives. The annual results for cooling, heating, etc., help design teams understand what is driving their overall energy use. For example, in the figure to the right, the red section represents the heating energy component. At almost 1/3 of the overall energy use, the design team can quickly conclude that heating is driving the energy use of the building and make appropriate design changes to mitigate this energy use.
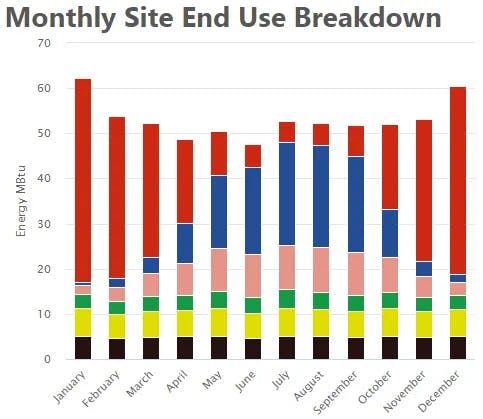
Looking at these same results from a monthly perspective can help design teams understand how changes in the local climate can impact the energy result breakdown throughout the year. For example, in the northern hemisphere, we expect colder temperatures during winter, as shown in the figure to the left. We also see that cooling does increase in the summer months, but never to the extent of heating.
Whole Building Energy Results can also be viewed at high resolution, from an hourly perspective. With 8760 hours in the year, the hourly results generated by a building energy model can make up a large data set. Hourly results are not typically used to communicate ideas with the entire design team. Instead, they are used by the engineer, energy modeler, or consultant to examine performance. It is best to review these results in line graphs for increased control when studying a specific period. For example, if the annual results do not match expectations based on benchmarking and past project experience, the annual view provides limited data to investigate the cause. Increasing the resolution of the view and inspecting results on an hourly basis can reveal patterns that will point towards the necessary modifications to the model or design to adjust the energy use.
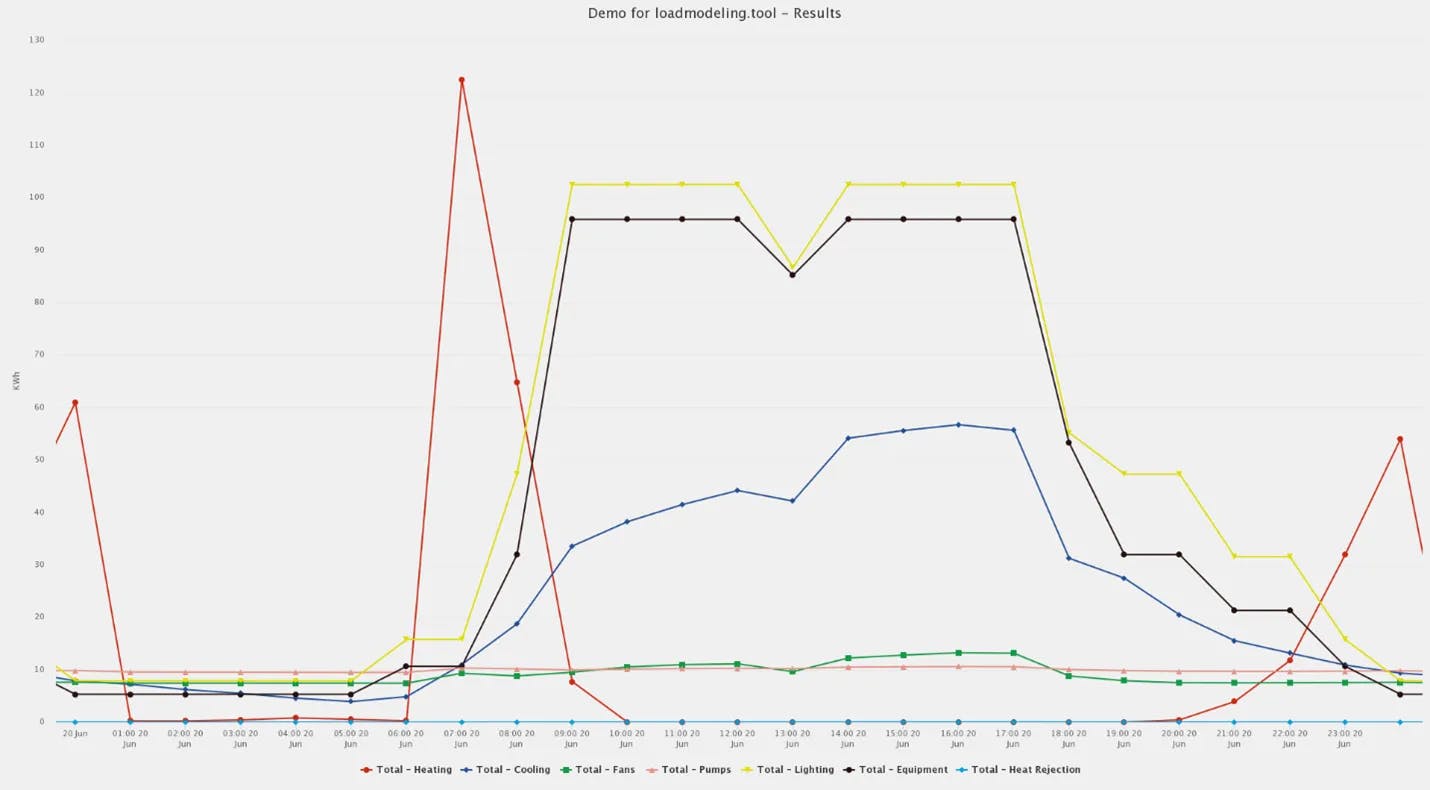
The figure below shows one example of site energy use results for a 24-hour period. We can see the variation of lighting and equipment usage when occupants enter the building in the morning, when some leave for lunch, and when all start to exit the building in the evening. We can also see that cooling-based energy usage is increasing throughout the day, until the sun sets, which quickly reduces the cooling-based energy demand. Finally, we see a spike in heating-based energy usage right before occupants arrive. This energy-use spike hints that the building controls may not be set up correctly. Instead of using a large amount of energy early in the morning, the system should rely on the internal heat gains to bring the thermal zones to the desired temperature.
Beyond Energy Results
Whole Building Energy Models produce additional results, other than energy, for components in the building. One example is the whole building heating and cooling loads. These are the coincident loads of all the thermal zones and HVAC systems and can help identify whether heating or cooling will represent a larger proportion of the total energy use. Another example is the hourly data from the weather file, which includes the outdoor temperatures, wind speeds, and solar radiation.
Diving further into the building’s performance, BEM Results can include the hourly behaviors for each thermal zone. Having access to these behaviors can help design teams understand how each unique zone behavior interacts with its respective HVAC system. The National Renewable Energy Laboratory and other organizations also curate large datasets for end-use load profiles to highlight the time-sensitive impacts on building performance.
Wrapping Up: Key Takeaways from Whole Building Energy Models
Whole Building Energy Models, or BEMs, are powerful tools that help design teams deliver high-performing, low-energy building designs. BEMs are also used to support code compliance, submit for certifications, and receive incentives. The results from BEMs are large data sets that include hourly energy use, heating and cooling loads, weather information, and more.
It is best to view BEM results from an annual or monthly perspective, as this resolution can help design teams of architects, engineers, owners, and operators understand building performance and make decisions. Hourly results allow for detailed examination and help the engineer, energy modeler, or consultant provide guidance on the best solutions. The key to successfully using the hourly results from BEM is zooming into specific periods of interest.
Projects of all scopes and scales can benefit from Whole Building Energy Modeling. BEM is a critical tool for building decarbonization and is encouraged by the US Department of Energy and The American Institute of Architects.
Want to learn more about Whole Building Energy Modeling? Check out our help center for more information!