1. Introduction:
The purpose of this study is to observe the sensitivity of the modeled window shapes on the Energy Use Intensity (EUI). The total window area for each side is kept constant along with other building parameters to record the impact of window shapes on total building energy use. The study is conducted using the small office building prototype provided by Pacific National Northwest Laboratory (PNNL).
Key Observations:
The Energy Usage Intensity (EUI) is observed for single zone small office PNNL prototype model for 3 different window shapes while keeping the overall window area constant. The Maximum EUI difference for Miami, Florida (ASHRAE Climate Zone 1A), Atlanta, Georgia (ASHRAE Climate Zone 3C) and Denver, Colorado (ASHRAE Climate Zone 5B) was observed to be 0.71 kBtu/sqft, 0.53 kBtu/sqft and 0.43 kBtu/sqft respectively.
Furthermore, the next iteration was done by adding overall 20% more glazing distributed on all sides and modeling 3 different window shapes while keeping the increased glazing area constant. After running the simulations, the maximum EUI difference for Miami, Florida (ASHRAE Climate Zone 1A), Atlanta, Georgia (ASHRAE Climate Zone 3C) and Denver, Colorado (ASHRAE Climate Zone 5B) was observed to be 0.56 kBtu/ft2, 0.47 kBtu/ft2 and 0.46 kBtu/ft2 respectively.
Methodology:
Building Parameters:
The selected building is a small office prototype described by Pacific Northwest National Laboratory (PNNL). Some of the building parameters are mentioned below:

Modeled Window Shapes
The single thermal zone is considered for running the simulations. The PNNL small office model is created utilizing EnergyPlus and three different window shapes are modeled keeping the total window area constant for all sides. The next step involved adding overall 20% more glazing distributed on all sides of the prepared model and rerunning the simulation.
1. Window Pattern 1
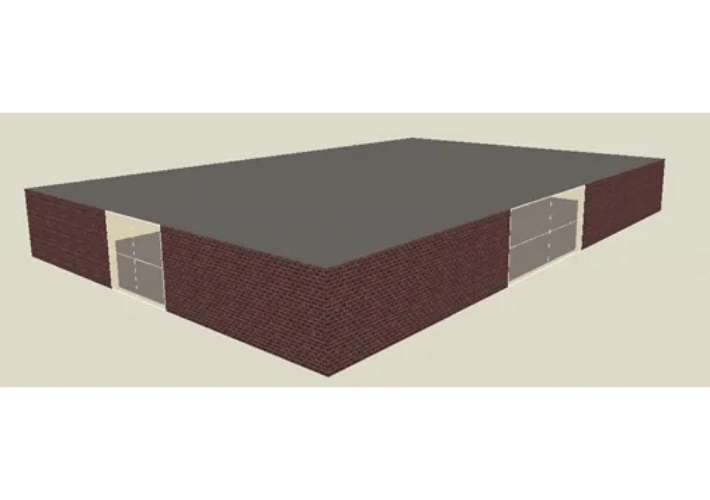
Figure 1 Window Pattern 1 for Single Zone PNNL Small Office Prototype
2. Window Pattern 2
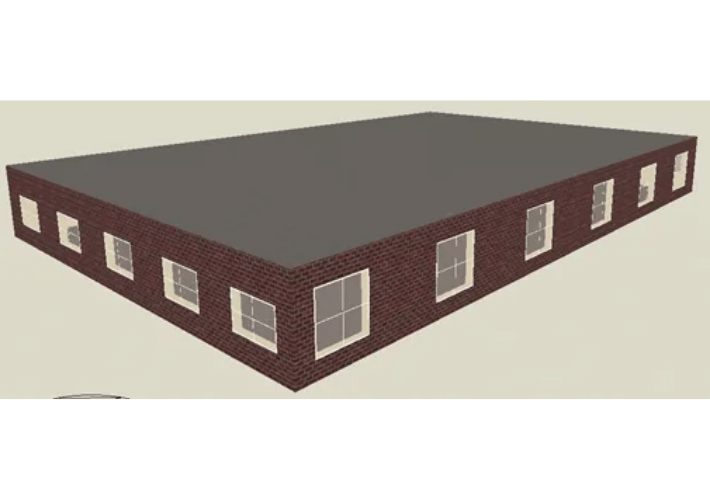
Figure 2 Window Pattern 2 for Single Zone PNNL Small Office Prototype
3. Window Pattern 3
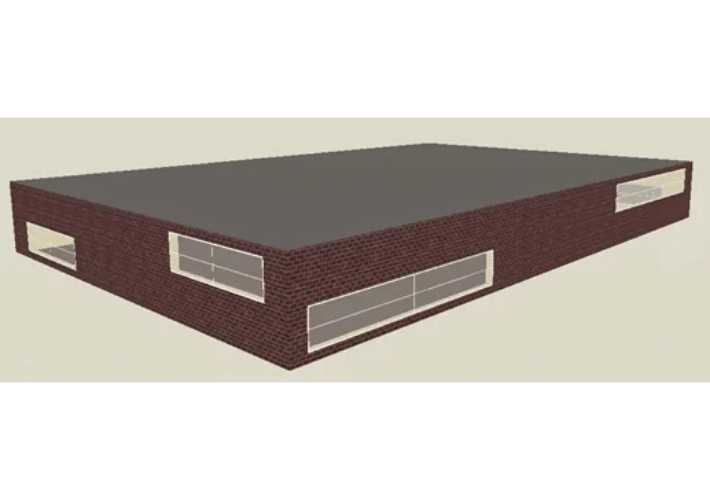
Figure 3 Window Pattern 3 for Single Zone PNNL Small Office Prototype
Comparison of Energy Usage Intensity
The following cities are used to study the impact of rotating the single zone PNNL small office prototype:

Zone 1A Miami, Florida:
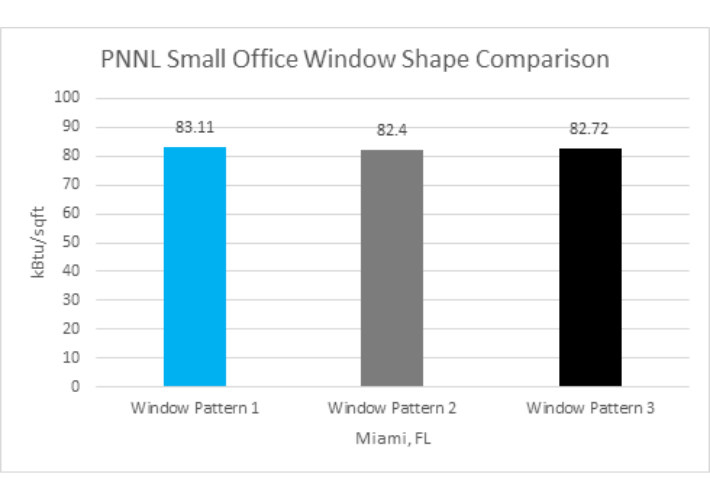
Figure 4 Window Shapes EUI Comparison for Single Zone PNNL Small Office Prototype
Zone 1A Miami, Florida:

Figure 5 Window Shapes EUI Comparison for Miami Single Zone PNNL Small Office Prototype with 20% more Glazing
For Miami, Florida (ASHRAE Climate Zone 1A), the highest EUI difference of 0.71 kBtu/ft2 is recorded between window pattern 1 and window pattern 2 for PNNL Small Office prototype with overall window to wall ratio (WWR) of 21.16%. When the overall glazing area is increased by 20%, the highest EUI difference became 0.56 kBtu/ft2 between pattern 1 and pattern 2.
Zone 3A Atlanta, Georgia:
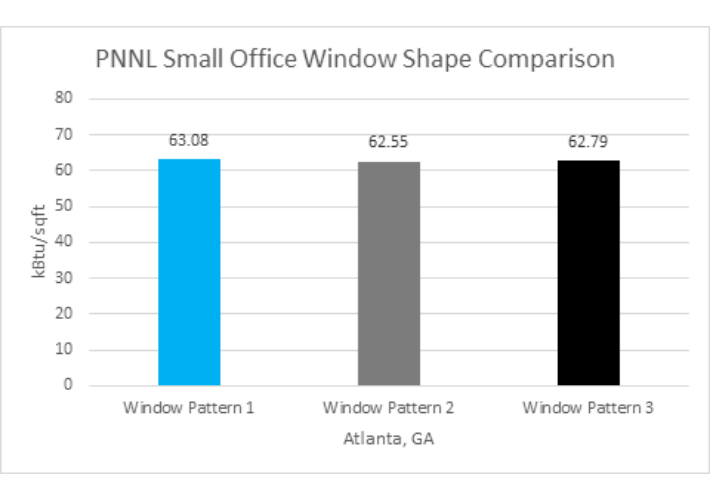
Figure 6 Window Shapes EUI Comparison for Atlanta Single Zone PNNL Small Office Prototype
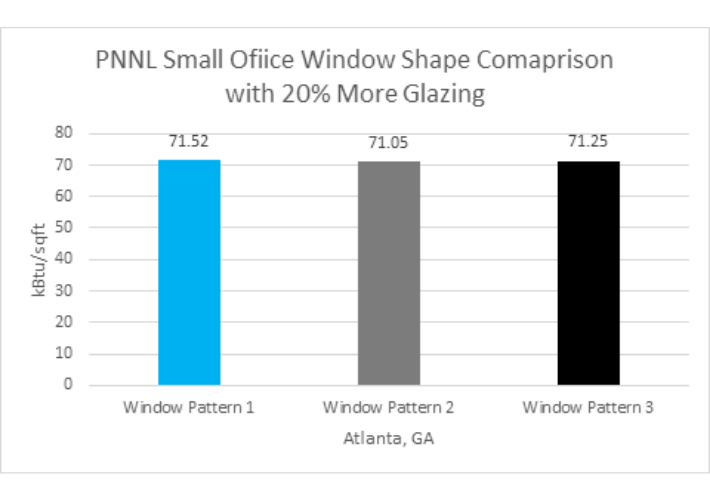
Figure 7 Window Shapes EUI Comparison for Atlanta Single Zone PNNL Small Office Prototype with 20% more Glazing
Zone 5B Denver, Colorado:

Figure 8 Window Shapes EUI Comparison for Denver Single Zone PNNL Small Office Prototype
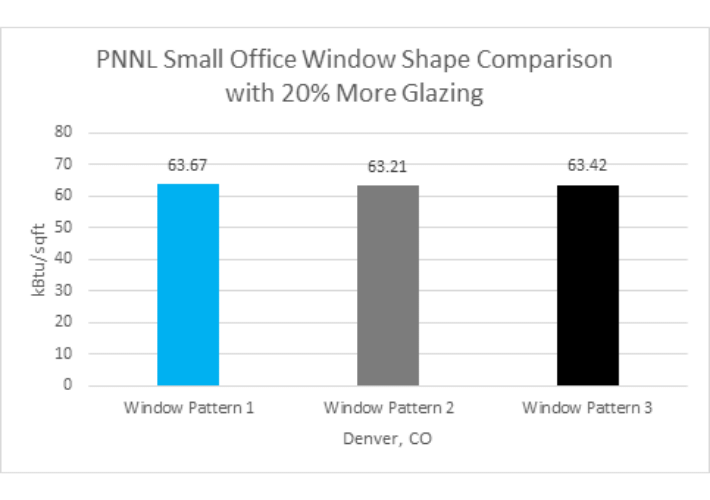
Figure 9 Window Shapes EUI Comparison for Denver Single Zone PNNL Small Office Prototype with 20% more Glazing
For Denver, Colorado (ASHRAE Climate Zone 5B), the highest EUI difference of 0.43 kBtu/ft2 is recorded between window pattern 1 and window pattern 2 for PNNL Small Office prototype with overall window to wall ratio (WWR) of 21.16%. When the overall glazing area is increased by 20%, the highest EUI difference became 0.46 kBtu/ft2 between pattern 1 and pattern 2.
Conclusion
The modeling the different window shapes can be a time consuming task depending upon the geometry of the building. The discussed study confirms that the shape of the modeled windows has very little to no impact on the overall EUI of the building. As long as the overall window area is modeled on the respective wall area, the heat balance simulation would produce the same EUI consumption rate regardless of the window shapes. The facts confirmed in this study will surely help to reduce the time spent on modeling the window shapes and quickly getting the accurate results.